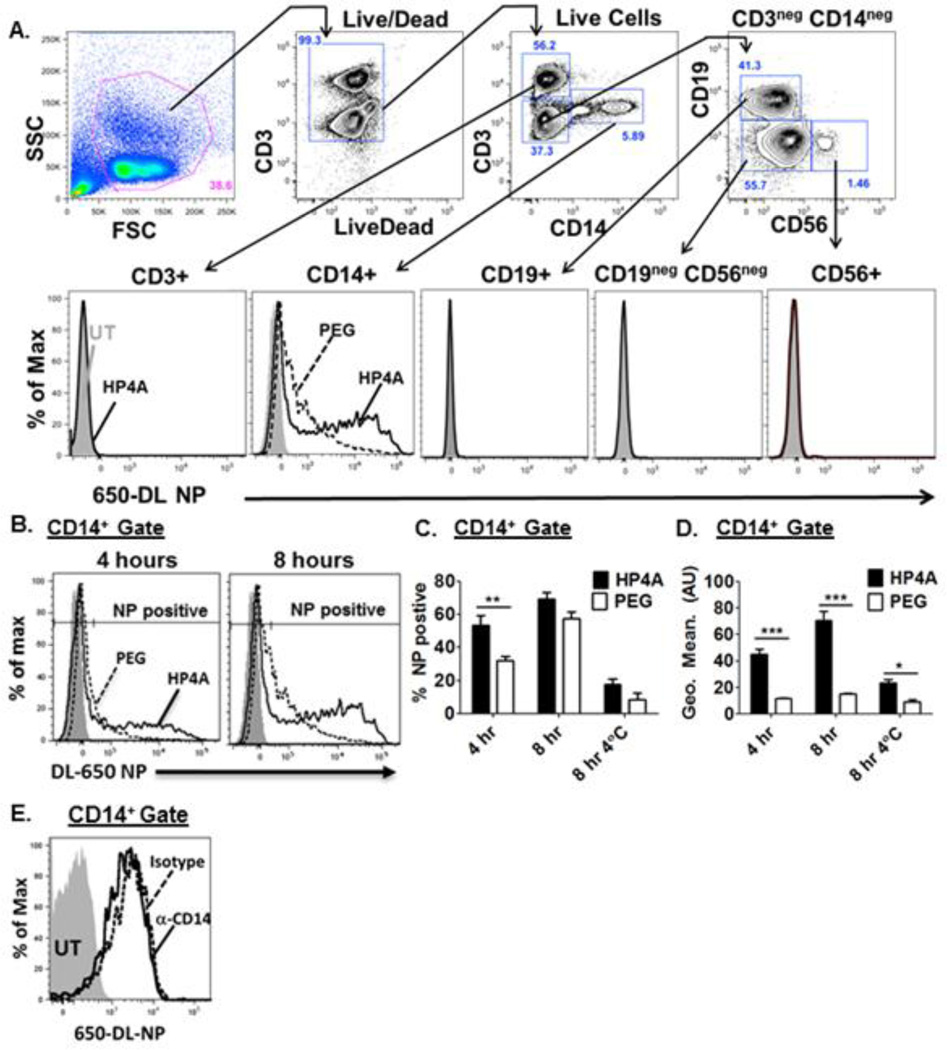
Figure 3. HP4A-based 80×320 nm rod uptake by primary human PBMC.
(A) Gating scheme used to analyze HP4A and HP4A-PEG NP uptake by T cells (CD3+), monocytes (CD14+), B cells (CD19+) and NK cells (CD56+) (B) Representative plot of HP 4 A (solid black) and HP4A-PEG (dashed black) NP uptake by CD14 + cells after 4 and 8 hr treatment with NP (10 µg/ml). Grey fill, untreated cells. (C+D) Combined data from 4 donors for frequency of CD14 + NP + cells (C) and mean fluorescence intensity (MFI) of NP signal within the CD14 + NP + gate (D). (E) Uptake of HP 4 A-NP (10 µg/ml) by CD14 + hu-PBMC at 8 hr in the presence of CD14 blocking antibody (50 µg/ml), solid line or isotype control antibody (50 µg/ml), dashed line. Statistical analysis by 2-way ANOVA. *P<0.05, **P<0.01, ***P<0.001 Data in A-D are representative of two independent experiments using a total of 8 donors. Data in E are representative of two independent experiments using a total of 5 donors.

