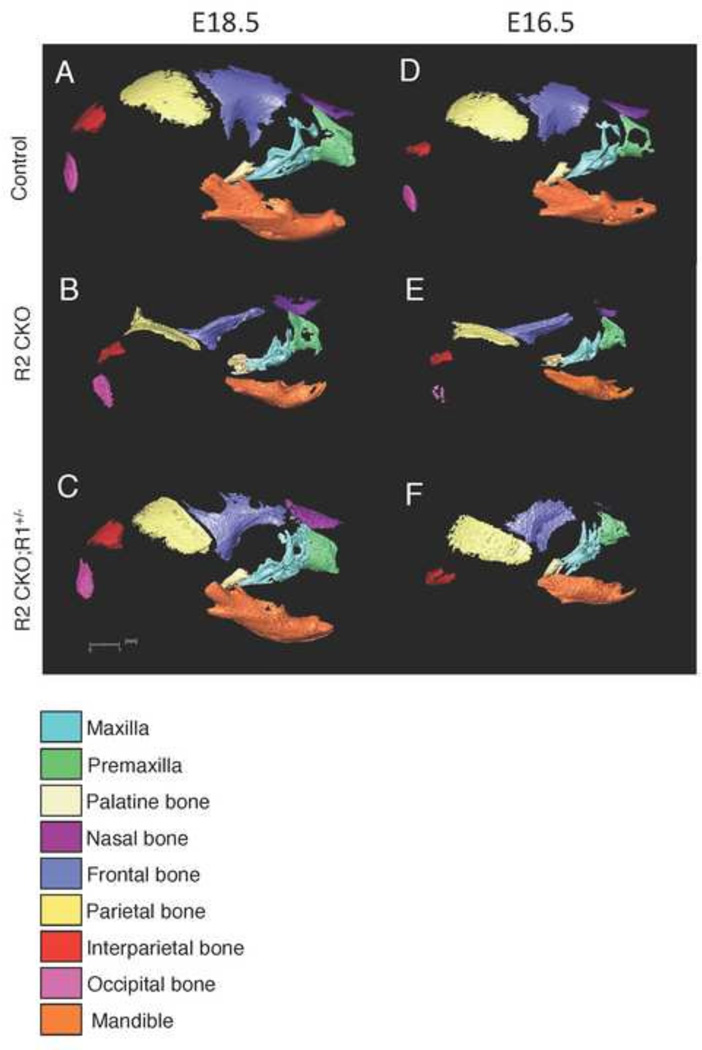
Figure 1. 3D microCT images of control, Tgfbr2fl/fl;Wnt1-Cre, and Tgfbr2fl/fl;Wnt1-Cre;Alk5fl/+ mice at E16.5 and E18.5.
A–C: 3D reconstruction from microCT images of E18.5 control (Control; A), Tgfbr2fl/fl;Wnt1-Cre (R2 CKO; B), and Tgfbr2fl/fl;Wnt1-Cre;Alk5fl/+ (R2 CKO;R1+/−; C) mice. D–F: 3D reconstruction from microCT images of E16.5 control (Control; D), Tgfbr2fl/fl;Wnt1-Cre (R2 CKO; E), and Tgfbr2fl/fl;Wnt1-Cre;Alk5fl/+ (R2 CKO;R1+/−; F) mice. Colors identify the maxilla (turquoise), premaxilla (green), palatine bone (beige), nasal bone (purple), frontal bone (blue), parietal bone (yellow), interparietal bone (red), occipital bone (pink), and mandible (orange). Scale bar: 1 millimeter.

