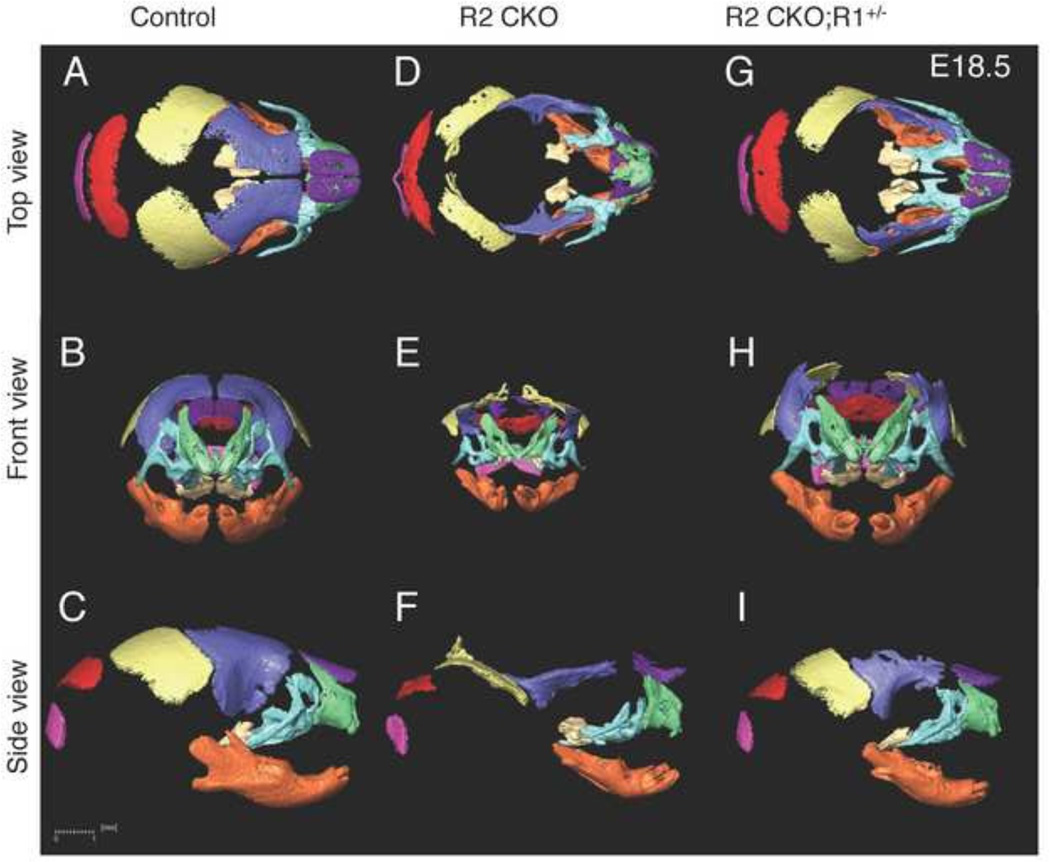
Figure 2. 3D microCT images of control, Tgfbr2fl/fl;Wnt1-Cre, and Tgfbr2fl/fl;Wnt1-Cre;Alk5fl/+ mice.
A–I: 3D reconstruction from microCT images of E18.5 control (Control; A–C), Tgfbr2fl/fl;Wnt1-Cre (R2 CKO; D–F), and Tgfbr2fl/fl;Wnt1-Cre;Alk5fl/+ (R2 CKO;R1+/−; GI) mice. (A, D, G) Top view; (B, E, H): front view; (C, F, I) top view. Scale bar: 1 millimeter.

