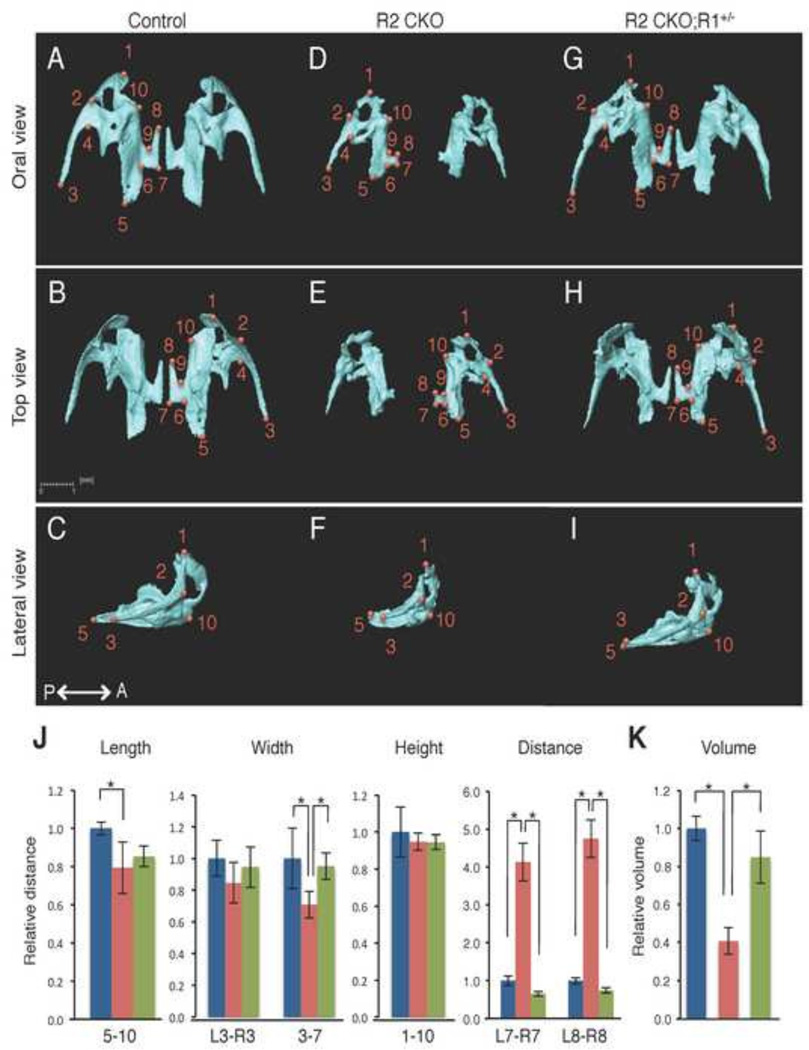
Figure 4. Comparison of the size and volume of the maxilla at E18.5.
A–I: Isolated maxilla from control (A–C), Tgfbr2fl/fl;Wnt1-Cre (R2 CKO; D–F), Tgfbr2fl/fl;Wnt1-Cre;Alk5fl/+ mice (R2 CKO;R1+/−; G–I) mice. P←→A: Posterior to Anterior J: Quantification of the size (length, width, height, and distance) of the maxilla from control (blue bars), Tgfbr2fl/fl;Wnt1-Cre (red bars), and Tgfbr2fl/fl;Wnt1-Cre;Alk5fl/+ (green bars) mice. *p<0.01. K: Quantification of the volume of the maxilla from control (blue bar), Tgfbr2fl/fl;Wnt1-Cre (red bar), and Tgfbr2fl/fl;Wnt1-Cre;Alk5fl/+ mice (green bar) mice. *p<0.01. Definitions of landmarks: 1. Anterior point of the maxilla; 2. Lateral inferior intersection of the frontal and zygomatic process; 3. Tip of the zygomatic process of maxilla; 4. Anterio-medial point to the zygomatic process; 5. Posterior point of the maxilla; 6. Posterior-lateral point of the palatine process of the maxilla; 7. Posterior-medial point of the palatine process of the maxilla; 8. Most anterior-medial point of the palatine process of the maxilla; 9. Anterior-lateral point of the palatine process of the maxilla; 10. Medial point of the premaxillary-maxillary suture. Scale bar: 1 millimeter.

