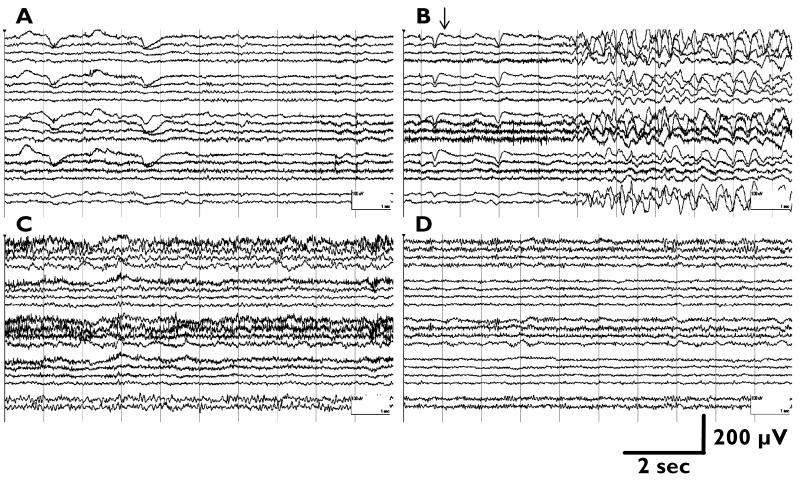
Figure 1.
An example of Wada EEG in a surgical candidate with left mesial temporal epilepsy. A) Baseline recording, showing left temporal slowing. B) After a left-sided 100 mg amobarbital injection (arrow), increases in bilateral (left more prominent than right) delta and theta, as well as faster frequency (alpha and beta) activity were noted. C) At 2.3 min after injection, more prominent alpha and beta activity and less prominent delta and theta activity was noted than initially. D) At 7 min after injection, EEG returns to baseline with residual left-sided alpha/beta activity. Longitudinal bipolar montage was shown; EEG traces in each panel (start from the top) represent Fp1/F3, F3/C3, C3/P3, P3/O1, (gap), Fp2/F4, F4/C4, C4/P4, P4/O2, F7/P7, P7/O1, (gap), Fp1/F7, F7/T7, T7/P7, P7/O1, (gap), Fp2/F8, F8/T8, T8/P8, P8/O2, (gap), Fz/Cz, Cz/Pz.

