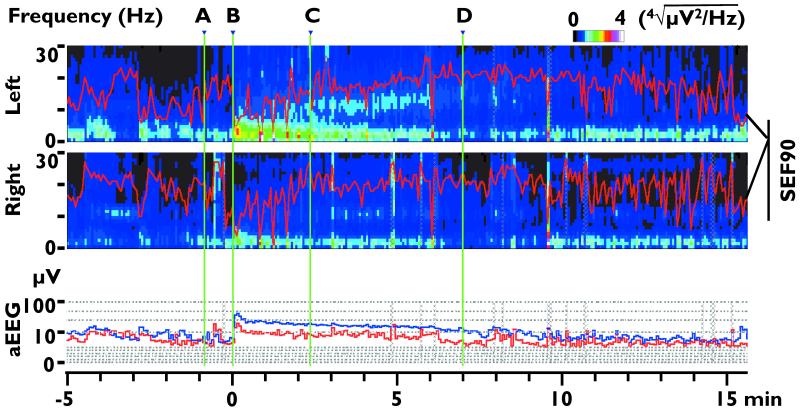
Figure 2.
Exemplary QEEG corresponding to Figure 1. The upper 2 panels show the left and right compressed spectrum (CSA), and 90% spectral edge frequency (SEF90, red lines overlapped on each spectrum). In order to better illustrate the spectrum in the higher frequency range, the power values (color-coded legend above the 1st panel) in the spectrum represent the 4th root of the actual power value. Lower panel shows aEEG median values of both sides (blue line: left; red line: right). The green vertical lines labeled A-D correspond to time points of panels in Figure 1. The vertical axis of aEEG is at 0-10 μV range on a linear scale and at 10-100 μV range on a logarithmic scale.

