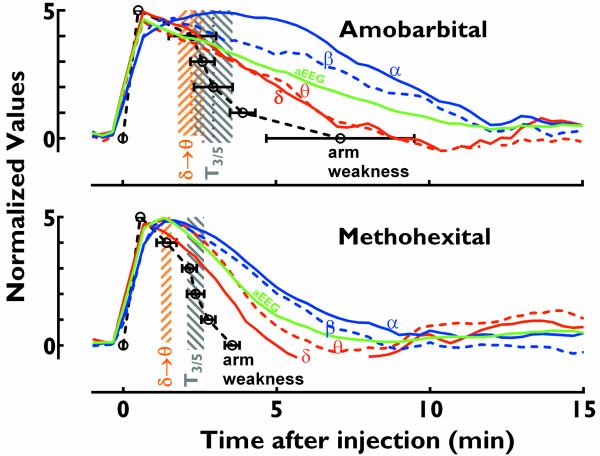
Figure 4.
Clinical correlation of QEEG values. Correlation of amplitude-normalized average ipsilateral QEEG trends for delta (σ, red solid line), theta (zθ, red dashed line), aEEG (green line), beta (β, blue dashed line), and alpha (α, blue solid line) with arm weakness (black open circles: average values; error bars, s.e.m.) in response to amobarbital (upper panel) and methohexital (lower panel) injections. Delta-to-theta transition time (σ θ, brown shadow) is earlier than the arm strength of 3/5 (gray shadow). QEEG curves were derived from moving averages of 3 data points in Figure 3. Values on Y-axis denoted relative effects, with 0 being baseline and 5 being maximal effect.

