Figure 6.

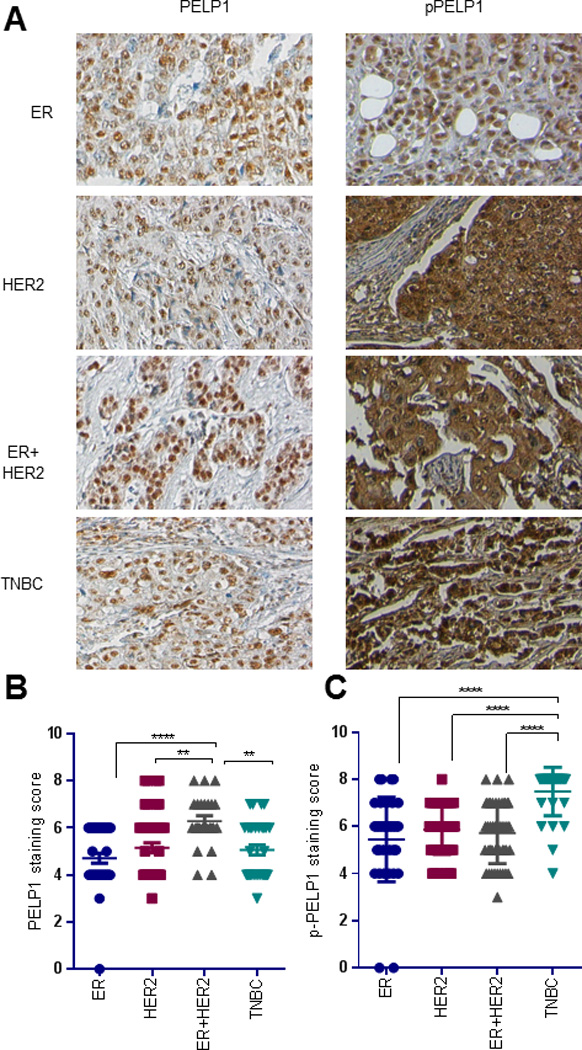
(A) Immunohistochemical staining of total PELP1 and pPELP1 (ser1033) on breast cancer tissues. Representative image of TMA stained with total PELP1 and p-PELP1 for each tumor type is shown. (B) Total PELP1 staining on tumor array was scored using Allred score system, and the average score for each tumor type was plotted on a graph. (C) p-PELP1 staining on tumor array was scored using Allred score system, and the average score of each tumor type was plotted on a graph. Statistical significance of differences in IHC scores was determined using Kruskal–Wallis test, followed by multiple comparisons using Dunn’s post test.
