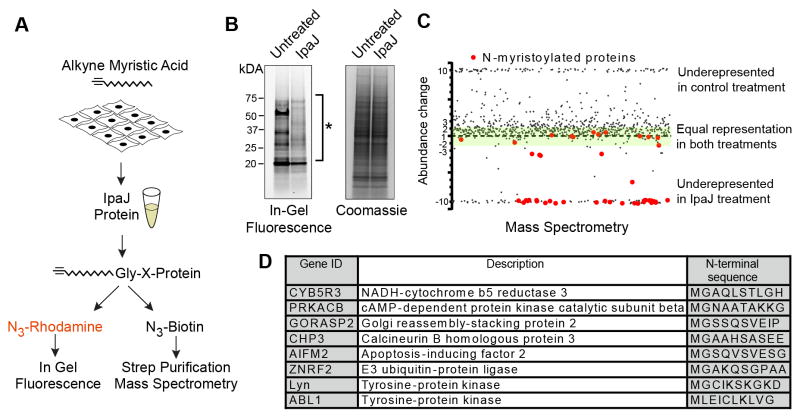
Figure 1. IpaJ cleaves majority of myristoylated proteins in vitro.
(A) Design of the experiment to analyze protein cleavage by recombinant IpaJ in vitro. Alk-12 labeled myristoylated proteins were conjugated azido-rhodamine for in-gel visualization or with azido-biotin for purification and mass-spectrometric analysis.
(B) In-gel fluorescent visualization (left) of myristoylome profile of HeLa cell extracts from untreated or IpaJ treated samples. Total protein is shown (right). * Indicates proteins cleaved by IpaJ.
C. Scatter Plot of results from differential mass-spectrometric analysis. Proteins that are known to be N-myristoylated are colored red. Y-axis shows the fold-increase or decrease of protein abundance in IpaJ-treated sample compared to untreated-treated samples. Green shading marks the area of 2-fold deviation of protein abundance in IpaJ-treated lysates. For visualization purpose more than 10 fold over- or under-representation is shown as approximately 10 or −10, respectively.
D. Identified N-myristoylated proteins showing the fold increase or decrease of peptide abundance between IpaJ treated and untreated samples.

