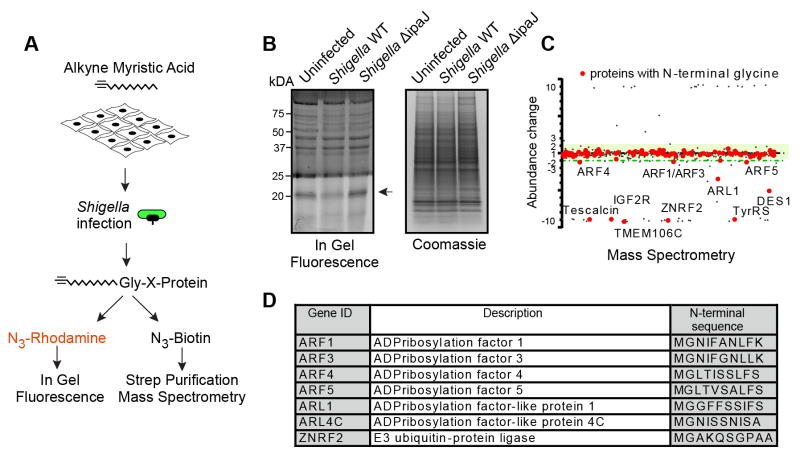
Figure 4. IpaJ has limited number of substrates during infection.
(A) Design of the experiment to analyze protein cleavage by IpaJ during Shigella infection. Alk-12 labeled myristoylated proteins were conjugated azido-rhodamine for in-gel visualization or with azido-biotin for purification and mass-spectrometric analysis.
(B) In-gel fluorescent visualization of myristoylome profile of uninfected, Shigella WT, or Shigella ΔipaJ infected cells (left). Total protein is shown (right). Arrow indicates proteins cleaved by IpaJ.
(C) Representative scatter Plot of results from differential mass-spectrometric analysis. Proteins with N-terminal Glycine are shown in red. Y-axis shows the fold-increase or decrease of protein abundance in WT Shigella infected samples compared to Shigella ΔipaJ treated cells. Green shading marks the area of 2-fold deviation of protein abundance. Myristoylated proteins falling below the green shading are cleaved by IpaJ. For visualization purpose more than 10 fold over- or under-representation is shown as approximately 10 or −10, respectively.
(D) Identified N-myristoylated proteins in one representative sample showing the fold increase or decrease of peptide abundance between WT Shigella and Shigella ΔipaJ infected cells.

