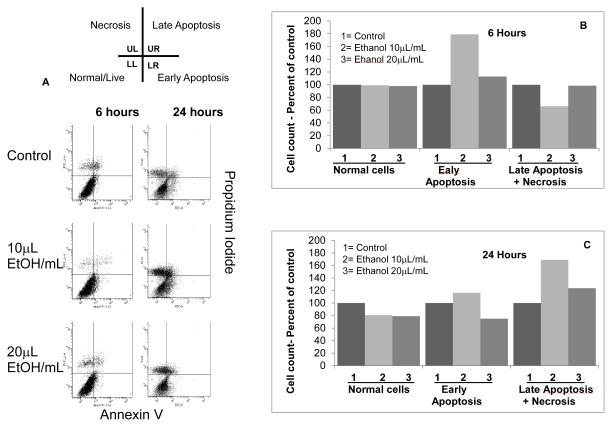
FIGURE 2. Ethanol causes dose- and time-dependent apoptotic changes in podocytes.
Control and ethanol-treated (0.2 or 0.4 mmol/mL) podocytes were stained using annexin V-FITC (x axis) and propidium iodide (y axis) at 6 and 24 hr and analyzed using flow cytometry. Data are presented as four quadrant distribution dot plots - Upper Left (UL), Upper Right (UR), Lower Left (LL) and Lower Right (LR). Combined data for late apoptosis and necrosis are presented (Late Apoptosis+Necrosis). Bar graphs summarize these observations at 6 and 24 hr that suggest increase in the number of apoptotic cells by 0.2 mmol/mL ethanol.
Normal cells (LL): At 6 hr, normal cells were comparable in all groups (70–80% of total cell count). At 24 hr, Ethanol-treated groups showed 20% decrease compared to the control.
Early Apoptosis (LR): Early apoptotic cells count was 79% (6h) and 16% (24h) higher than the time matched control in the 0.2 mmol/mL ethanol group. Cells showing early apoptosis in the ethanol-treated group (0.4 mmol/mL) were 13% (6h) higher and 25% (24h) lower than the control.
Late Apoptosis+Necrosis (UL+UR): Ethanol 0.2 mmol/mL caused a decline in the number of these cells at 6 hr but a 29% increase over control by 24 hr. The 0.4 mmol/mL ethanol-treated group showed 23% (24h) higher number of cells with late apoptosis+necrosis compared to the control group. Values represent average of two separate experiments.

