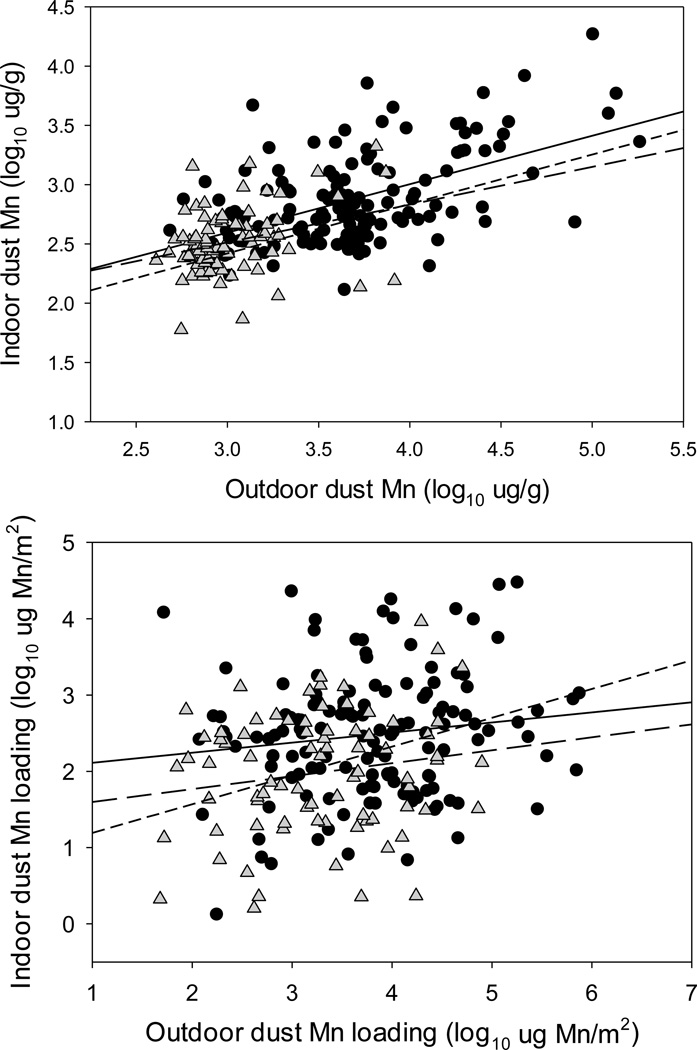
Figure 3.
Upper panel: Linear regression of outdoor vs. indoor household dust Mn concentrations across the three study sites: Bagnolo Mella, a community with active ferromanganese plant emissions (filled circles and solid regression line, y = 0.409(x) + 1.371, R2=0.2848, n=137, p<0.0001); Valcamonica, with a past history of past ferromanganese alloy plant activity (grey triangles, long dashed line, y = 0.318(x) + 1.559, R2=0.0923, n=79, P=0.0065), and; Garda Lake, with no history of ferromanganese plant activity (open circles, short dashed line, y = 0.417(x) + 1.170, R2= 0.0889, n=65, P=0.016). Lower panel: Outdoor vs. indoor household dust Mn loadings (log10 µg Mn/m2) across the three study sites: Bagnolo Mella (filled circles and solid regression line, y = 0.132(x) + 1.981, R2=0.0186, n=136, P=0.113); Valcamonica (grey triangles, long dashed line, y = 0.170(x) + 1.429, R2=0.0276, n=79, P=0.143), and Garda Lake (open circles, short dashed line, y = 0.378(x) + 0.813, R2= 0.0992, n=60, P=0.014). Regression lines extended to axis for clarity.

