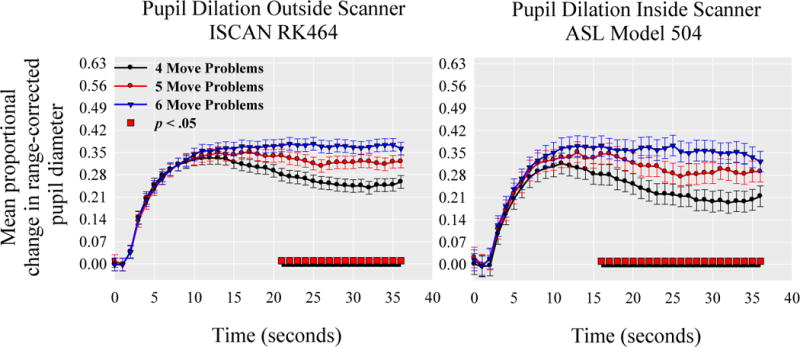
Fig. 4.

Pupil dilation in response to increasing levels of task load during the Tower of London separated by the type of pupilometer. The red bar under each pupil dilation waveform reflects where the omnibus test of differences in task-load at each time-point is statistically significant at p< 0.05. Black underlined segments indicate regions that are statistical significant after controlling for multiple comparisons.
