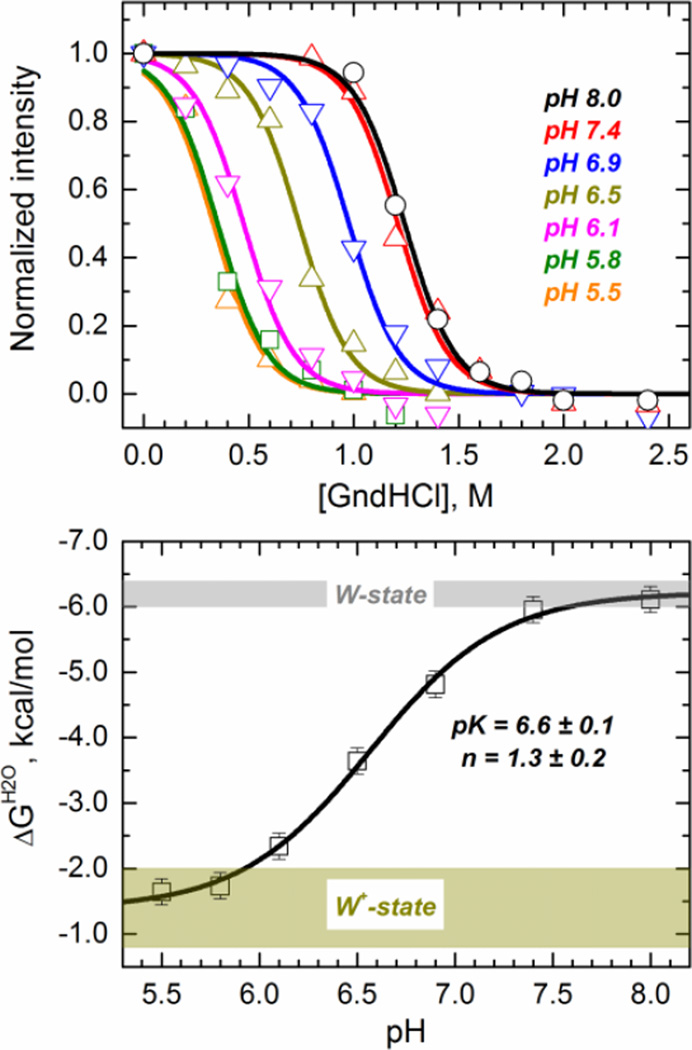
Fig. 4.
Chemical denaturation of the diphtheria toxin T-domain showing a loss of thermodynamic stability upon acidification. (Top panel) Chemical unfolding monitored by tryptophan fluorescence in the presence of various concentrations of guanidinium hydrochloride (GndHCl) at the indicated pH. Data was fitted to a two-state chemical unfolding model to obtain the ΔG of unfolding in the absence of denaturant (ΔGH2O) under the different pH conditions (Eq. 3). (Bottom panel) ΔGH2O of unfolding of the T-domain as a function of the pH (symbols). The line represent the fit with Eq. 4. The shadowed areas represent the limiting ΔGH2O values (±2 standard deviations) for the W-state (gray) and W+-state (dark yellow).

