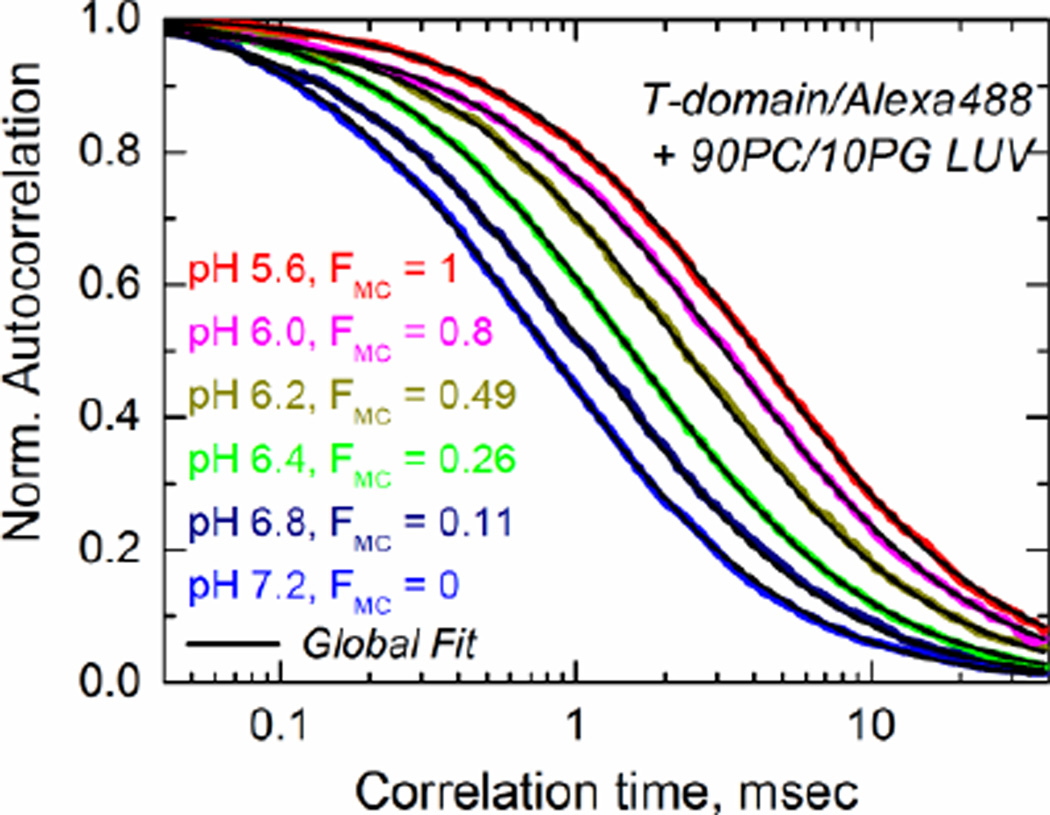
Fig. 5.
Example of pH-dependent binding measurement using FCS performed under conditions of the lipid saturation (4 mM lipid) over fluorescently labeled T-domain (nanomolar concentrations). Acidification results in a progressive shift of mobility from that of free T-domain to that of vesicle-bound domain. Quantitative determination of membrane competent fraction, FMC, is achieved by the linked analysis (black lines) of fluorescence autocorrelation curves (color-coded lines) that links the correlation times for all curves and allows free fitting of the pre-exponential amplitudes in Eq. 6 (Posokhov et al., 2008b). For the purpose of better visual representation all data are normalized to the same number of fluorescent particles in the focal volume (Note that the absolute values of amplitudes are not important under these conditions, but only their relative contributions).

