
Figure 4.
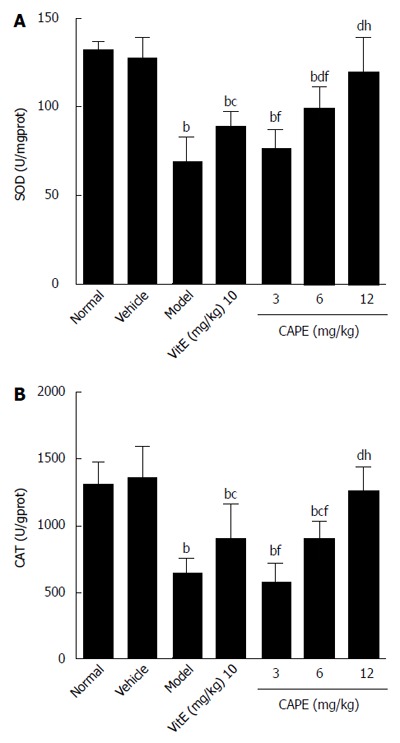
Superoxide dismutase and catalase activities in liver tissue. Bars and error bars mean ± SD. t = 4.552-11.06, bP < 0.01 vs normal group; t = 2.876-8.689, cP < 0.05, dP < 0.01 vs model group, respectively; t = 3.393-7.503, fP < 0.01 vs CAPE (12 mg/kg) group, respectively; t = 3.969-4.997, gP < 0.05, hP < 0.01 vs vit E group, respectively. CAPE: Caffeic acid phenethyl ester; Vit E: Vitamin E; SOD: Superoxide; CAT: Catalase.