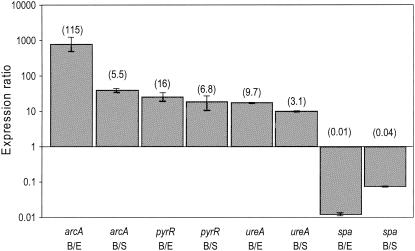
FIG. 5.
Relative expression levels as determined by real-time PCR. Expression levels of the arcA, pyrR, ureA, and spa genes was determined by real-time PCR. Relative expression levels are illustrated as the ratio of the expression level observed in biofilms (B) versus exponential-phase (E) or stationary-phase (S) planktonic cultures. The numbers in parentheses above the bars indicate the relative expression levels determined by transcriptional profiling.

