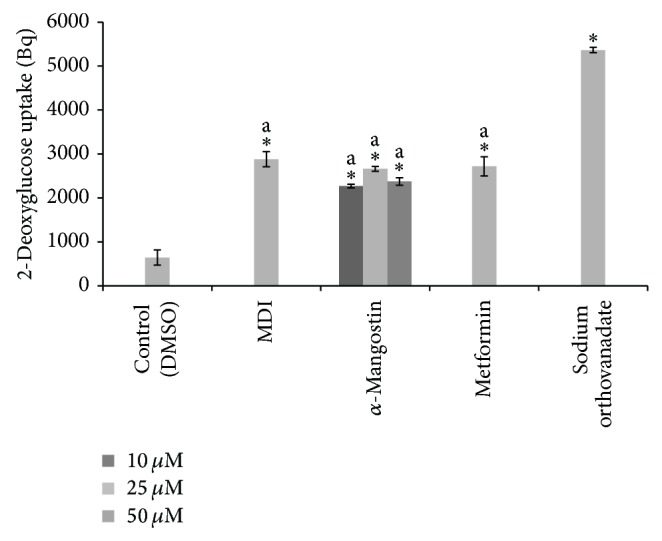
Figure 4.

The effects of different concentration of α-mangostin (10, 25, 50 μM) in glucose uptake of 3T3-L1 adipocytes. Data is represented as mean ± SD, with n = 3 per group. * P < 0.05 compared to control group (DMSO treated cells), a = significant at indicated concentration.
