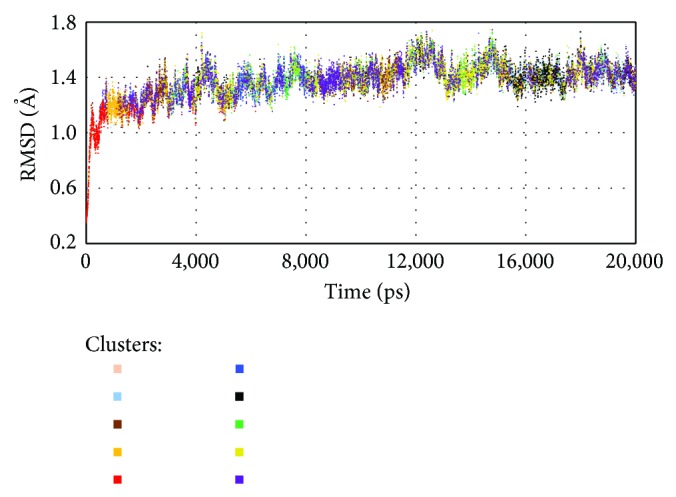
Figure 4.

Cluster distribution along the InhA enzyme MD trajectory from the optimal k-means partition. Each object represents different backbone (N, Cα, C, and O) RMSD values as a function of time over the trajectory which are colored based on their cluster memberships.
