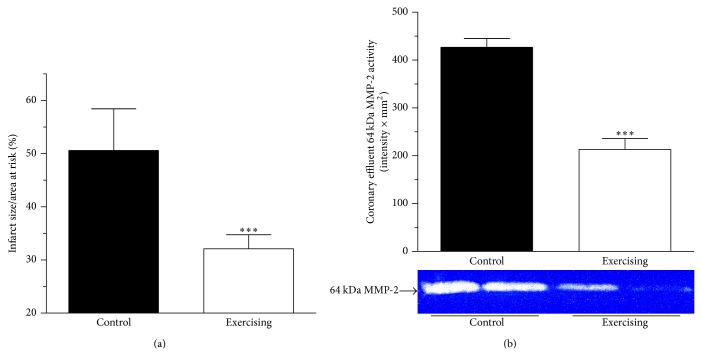
Figure 4.
(a) Infarct size is demonstrated as a percentage of the area at risk in control (■) and exercising (□) groups. Means ± S.E.M., n = 11-12. Statistical significance: *** P < 0.001 as compared with the control animals. (b) Densitometrically assessed MMP-2 activity in coronary effluent collected from isolated perfused hearts during the first 5 min of reperfusion (64 kDa MMP-2, expressed as intensity × mm2) in control (■) and exercising (□) rats. Means ± S.E.M., n = 10. Statistical significance: *** P < 0.001 as compared with the control group.

