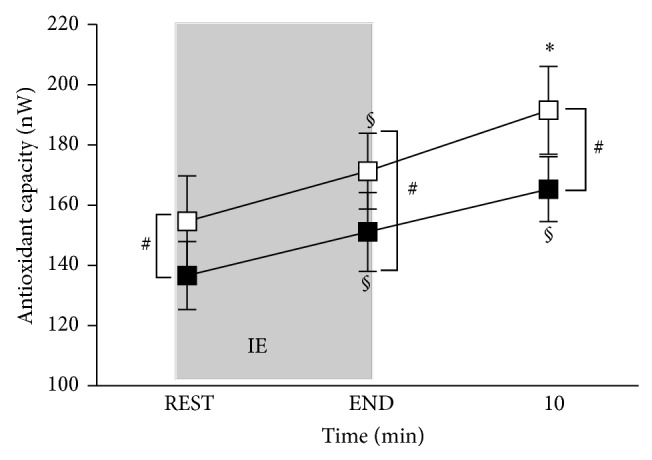
Figure 4.

Time course of antioxidant capacity (nW) before (REST) and immediately after the IE (END) and at 10 minutes of recovery: PRE Trg (full squares) and POST Trg (empty squares). Changes over time were significant in PRE Trg at P < 0.001 at the END of exercise and during recovery (10 minutes after exercise) (§); in POST Trg at P < 0.001 at the END (§) and P < 0.05 during recovery (10 minutes after exercise) (∗); P < 0.01 between PRE Trg and POST Trg at REST, END, and 10 minutes of recovery (# symbol).
