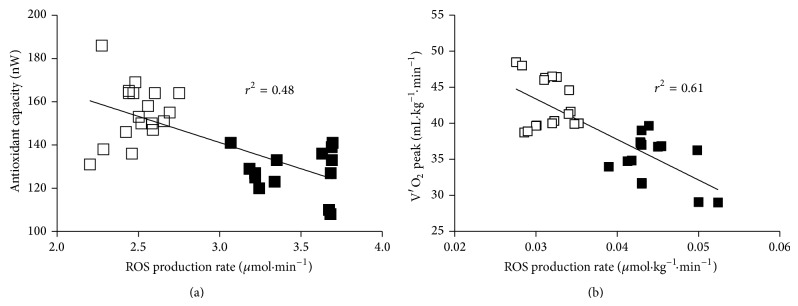
Figure 5.

Panel plots of relationship between ROS production rate (μmol·min−1) and (a) antioxidant capacity (nW) and (b) peak ROS production rate (μmol·min−1·kg−1) and V′O2 peak (mL·kg−1·min−1) recorded at the end of IE in the two sessions: before (PRE Trg, full squares) and after (POST Trg, empty squares) training. The linear regression fit (solid line) is also shown and so is the correlation coefficient (r 2) reported in each panel. A significant linear relationship in the ROS production between antioxidant capacity (P < 0.0001) and V′O2 peak (P < 0.0001) values was estimated.
