
Fig. 4. Overlap of regions with convergent specialized expression and speech activation.
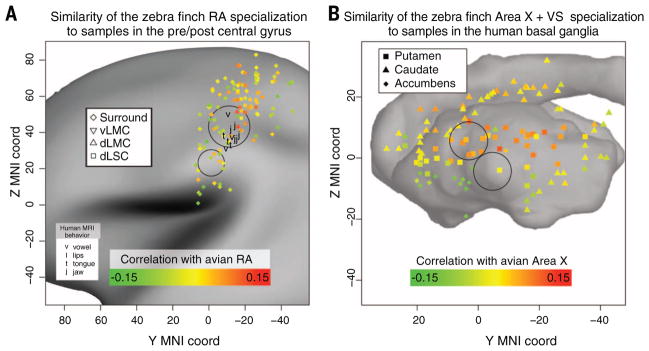
Shown are the coordinates in MNI (Montreal Neurological Institute) space of each human brain microarray sample from the striatum (A) and the precentral/postcentral gyrus (B). The different subregions within the striatum and precentral/postcentral gyrus are labeled by differently shaped symbols. These points are placed on top of a representative image of the cortical surface map from the Allen Human Brain Atlas (38). Only the left hemisphere, which has higher sample density, is shown. In (A), each point is colored on the basis of the correlation between the specialization of that sample relative to the entire human striatum, and of Area X relative to Area X and VS together. Circles represent high-confidence regions of speech activation from multiple coordinates in multiple studies (56–62). In (B), each point is colored on the basis of the correlation between the specialization of that sample relative to the entire human PrG/PoG, and of zebra finch’s RA specialization. A similar plot with the average of all vocal learners is shown in fig. S4C.