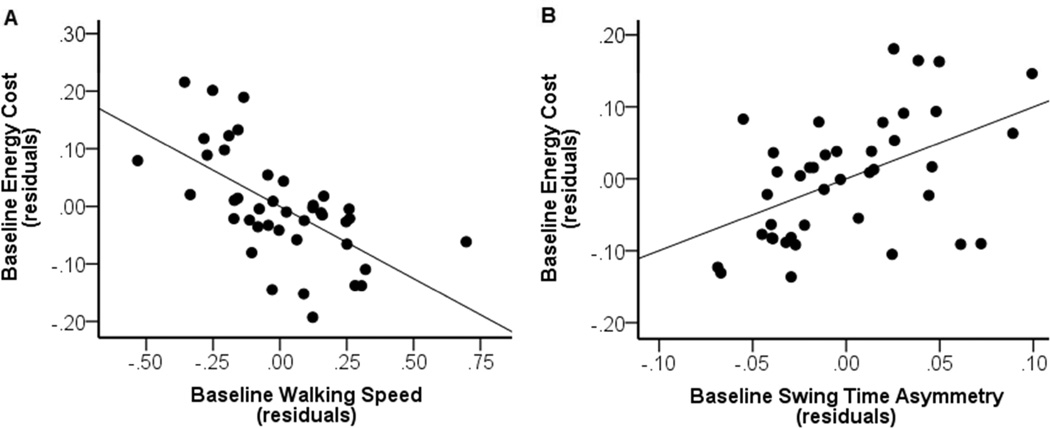
Figure 1.
Partial regression plots of the independent relationships between pretraining walking speed (panel A) and pretraining swing time asymmetry (panel B) versus the energy cost of walking when controlling for the non-significant predictor step length asymmetry. In panel A, the y-axis presents the residuals from regressing pretraining energy cost of walking on the independent predictors step length asymmetry and swing time asymmetry. In panel B, the y-axis presents the residuals from regressing the energy cost of walking on step length asymmetry and walking speed. On the x-axes are the residuals from regressing walking speed on the independent predictors step length asymmetry and swing time asymmetry (in panel A) and step length asymmetry and walking speed (in panel B). Faster walking speeds and less swing time asymmetry each independently predicted lower energy costs of walking.

