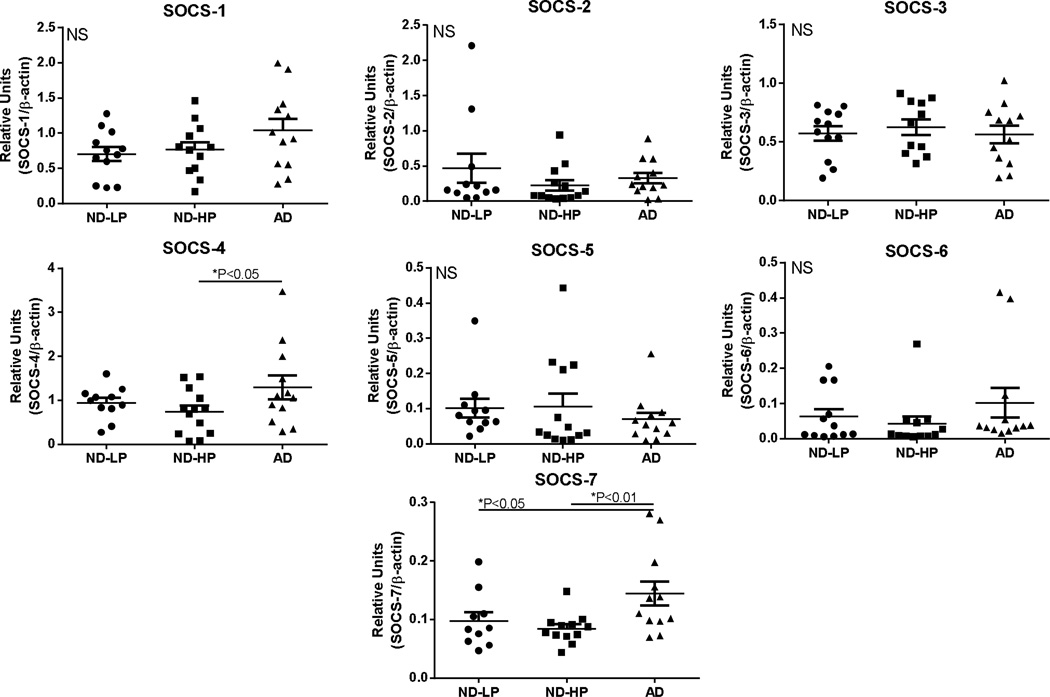
Fig. 8. Relative levels of SOCS proteins in middle temporal gyrus samples from non-demented (ND) and Alzheimer’s disease (AD) cases.
Scatter plots show protein levels for SOCS-1, SOCS-2, SOCS-3, SOCS-4, SOCS-5, SOCS-6 and SOCS-7 in indicated human brain samples. ND-LP (n=12); ND-HP (n=12); AD (n=12). Lines represent mean values ± SEM. ND cases contained 12 LP cases and 12 HP cases. Significant differences between groups indicated for SOCS-4 and SOCS-7. Statistical analysis was one-way Analysis of Variance (ANOVA) followed by Fisher LSD post-hoc test for between group significance.
Abbreviations: ND-LP: non-demented low plaque (scores <5): ND-HP: non-demented high plaque (scores >5). AD: Alzheimer’s disease.

