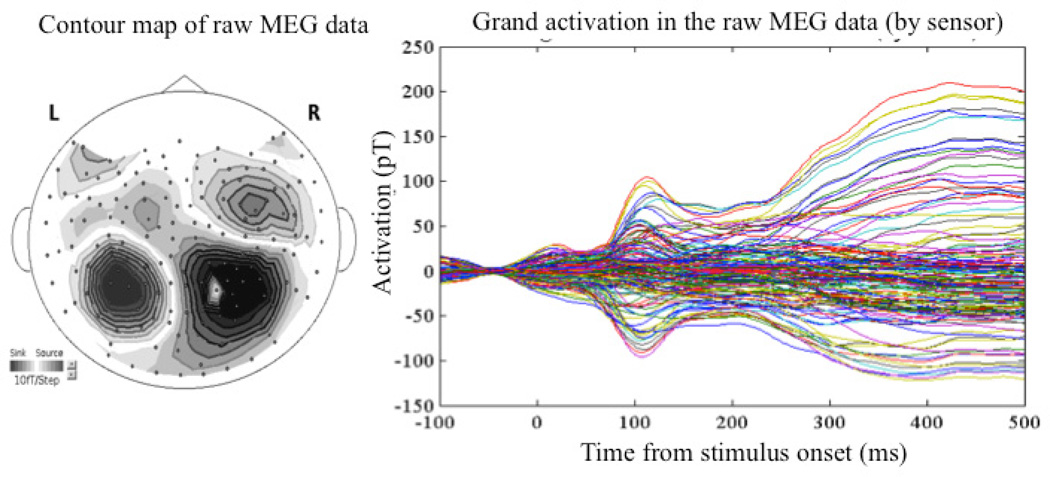
Figure 2.
Top left: Contour map of the grand average auditory M100 component; Top right: Grand average waveforms of the raw MEG data by sensor averaged over all trials and subjects; Center: Regions of interest (faint green blobs) and average activation displayed on the standard inflated brain in MNE. Bottom: Average time course of activation within ROIs in arbitrary dSPM units.

