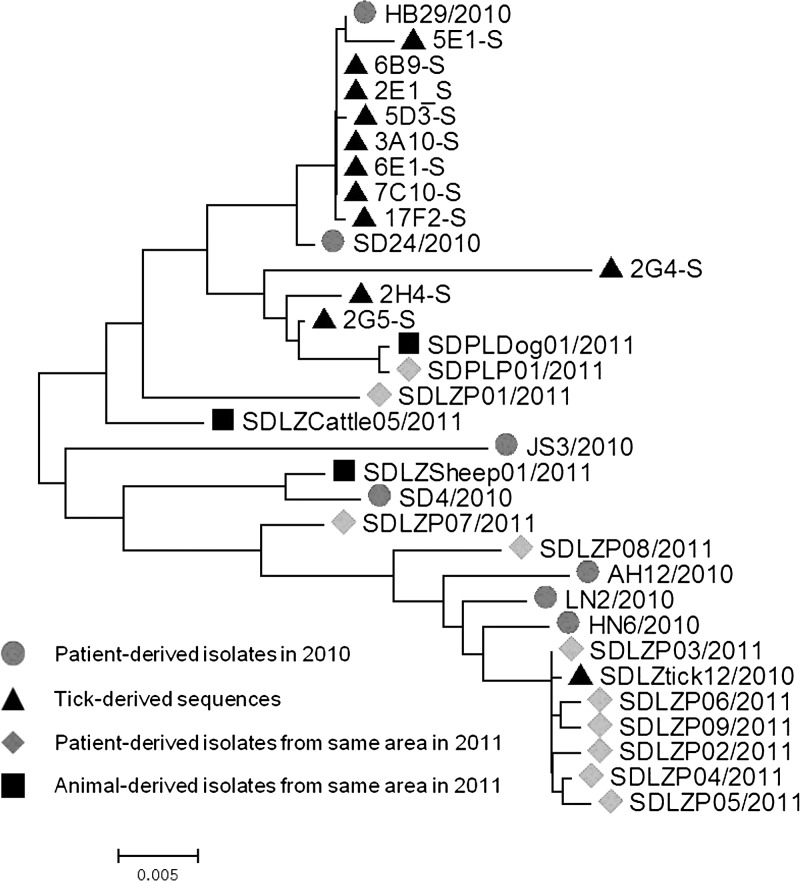
Figure 3.
Phylogenetic analysis of SFTSV S-segment sequences amplified from ticks. A phylogenetic tree based on S-segment sequences for representative viruses derived from humans, animals, and ticks inferred by the NJ method using MEGA 5 is shown. The tree was drawn to scale, with branch lengths representing the number of nucleotide substitutions per site. Dots indicate the patient-derived sequences amplified in 2010; triangles indicate the sequences amplified from ticks in this study. Diamonds indicate the sequences isolated from patients, and squares indicate the sequences isolated from domestic animals.

