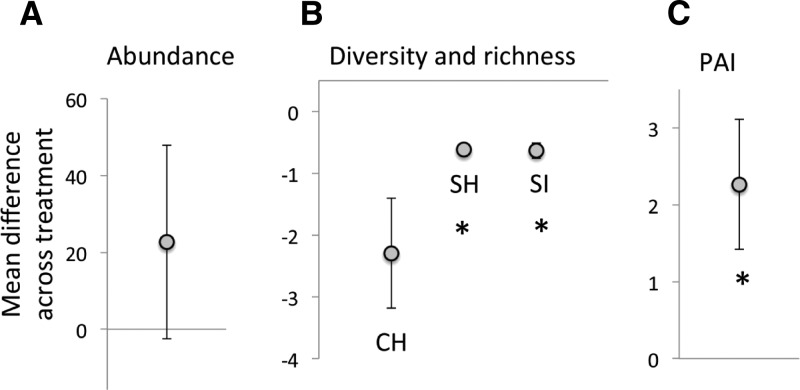
Figure 2.
Mean difference (±SD) between land-use treatments (agricultural vs. conserved) of (A) rodent abundance, (B) rodent community diversity, and (C) plague activity index (PAI); positive values indicate increases in agricultural treatments. For rodent community diversity, the following metrics were used: Chao 1 species richness (CH), Shannon diversity (SH), and Simpson diversity (SI). Asterisk (*) indicates significant differences between agricultural and conserved sites for each response variable. Rodent abundance (A) was consistently but not significantly elevated in agricultural sites as compared with adjacent conserved sites. Diversity trended significantly lower in agricultural sites for all metrics. PAI (predicted plague seropositive rodents) was roughly twice as high in agricultural vs. conserved sites.

