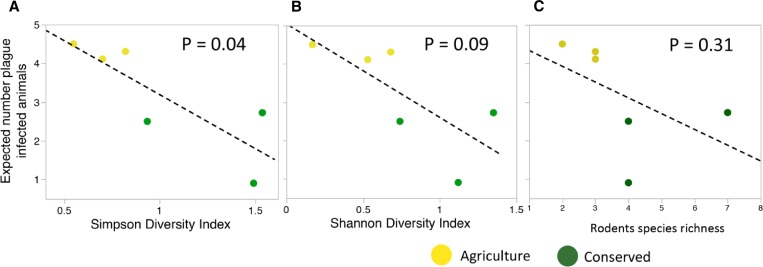
Figure 4.
A negative slope was observed for the relationship of plague activity index (PAI) and Simpson diversity (A), Shannon diversity (B), and species richness (C), with generally higher diversity and lower PAI in conserved sites. This relationship, however, was only significant for Simpson diversity.

