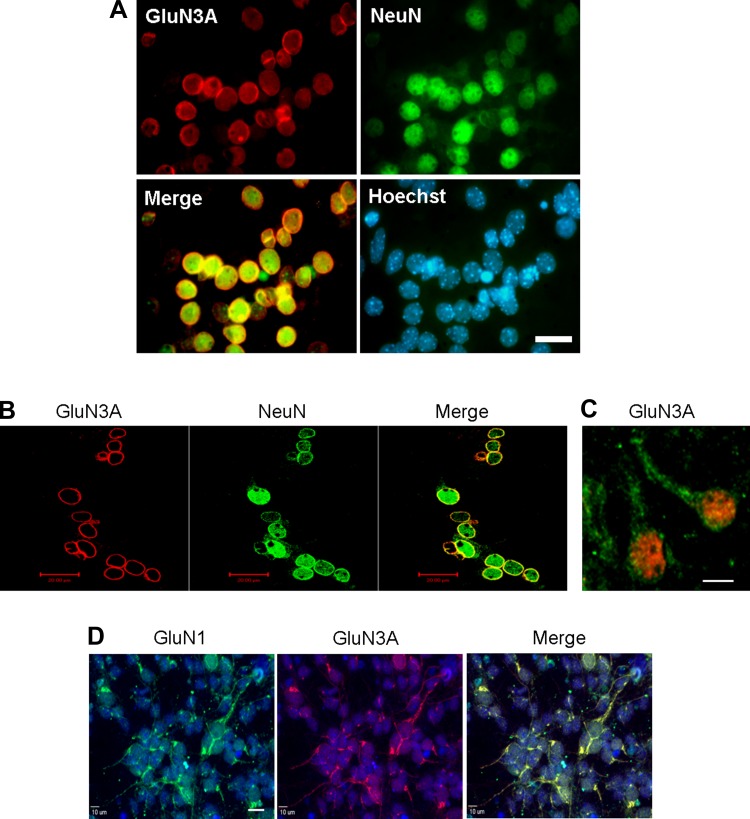
Fig. 2.
Cellular distribution of GluN3A in cortical neurons. Immunocytochemistry was used to investigate the distribution of GluN3A expression in primary cortical neurons. A and B: typical results of GluN3A immunoreactivity in primary cortical neurons were shown by the colocalization of the neuronal marker NeuN (red) and GluN3A (green). Total cells were visualized with Hoechst 33342 staining (blue). High levels of GluN3A immunoreactivity were mainly detected in the cell membrane. Scale bars = 20 μm. C: GluN3A (green) immunoreactivity, which was colocalized with NeuN (red), was detected not only in the cell membrane but also in the dendrites. Scale bars = 20 μm. D: immunocytochemistry showed colocalized labeling of GluN1 (green) and GluN3A (red) immunoreactivities in primary cortical neurons. Scale bars = 20 μm.

