
Figure 4. Fatty acid profile of HCT116 colorectal cancer cells in hypoxia.
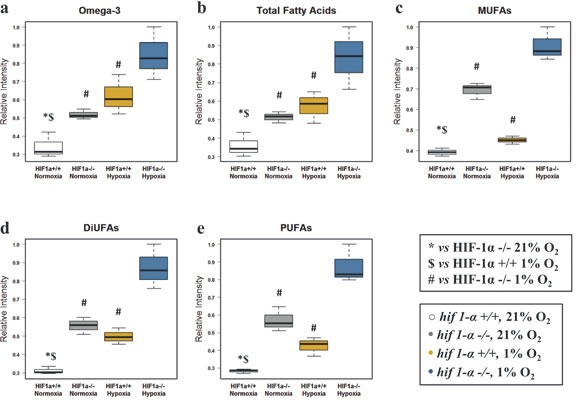
(a) Omega-3 fatty acids (b) total fatty acids (c) MUFAs (d) DiUFAs and (e) PUFAs were detected by 1H-NMR in the organic phase. Normalized relative intensities are reported as mean ±sd (n=3).