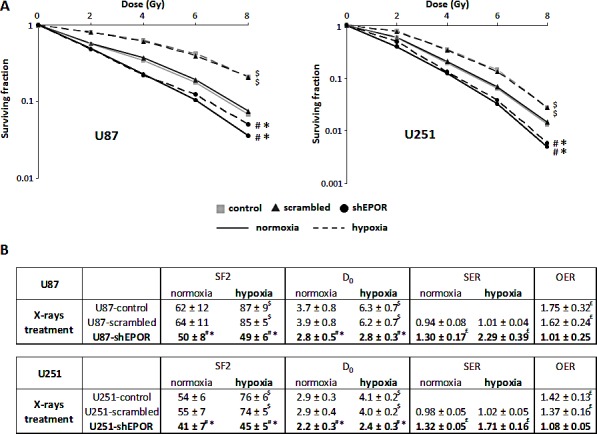
Figure 2. EPOR inhibition increases the sensitivity of glioma cells to ionising radiation and counteracts the hypoxia-dependant radioresistance.

The colony-formation assay was performed to determine the effects of various doses of X-rays (0, 2, 4, 6 and 8 Gy) on U87 and U251 cells in normoxic (21% O2) and hypoxic (1% O2) conditions. Colonies were counted 14 days and 21 days after radiation, for U251 and U87 cells respectively, to determine survival fraction (SF) and radiobiological parameters. (A) Effect of EPOR down-regulation on the response of U87 cells (left graph) or U251 cells (right graph) to radiation in normoxia and hypoxia. Mean ± SD, n=4 for each cell type; # p<0.0001 vs control cells in normoxic or hypoxic conditions, * p<0.0001 vs scrambled cells in normoxic or hypoxic conditions and $ p<0.0001 vs normoxia for each cell line (Fisher's PLSD post-hoc test after a significant two-way ANOVA (group and dose effects)). (B) Comparison of radiobiological parameters between control, scrambled and EPOR shRNA for the two glioma cell lines, U87 and U251, cultured in normoxic and hypoxic conditions. SF2=surviving fraction for 2 Gy; D0=mean lethal dose (dose for which SF is 37%); SER=sensitisation enhancement ratio (D0 control cells/D0 infected cells); OER=oxygen enhancement ratio (D0 hypoxia/D0 normoxia). Mean ± SD, n=4 for U87 and U251 cells. For SF2 and D0 parameters: # p<0.05 vs control cells in normoxic or hypoxic conditions, * p<0.05 vs scrambled cells in normoxic or hypoxic conditions and $ p<0.0001 vs normoxia for each cell line (Fisher's PLSD post-hoc test after a significant ANOVA). For SER and OER: £ p<0.05 vs theoretical value=1 (univariate t-test).
