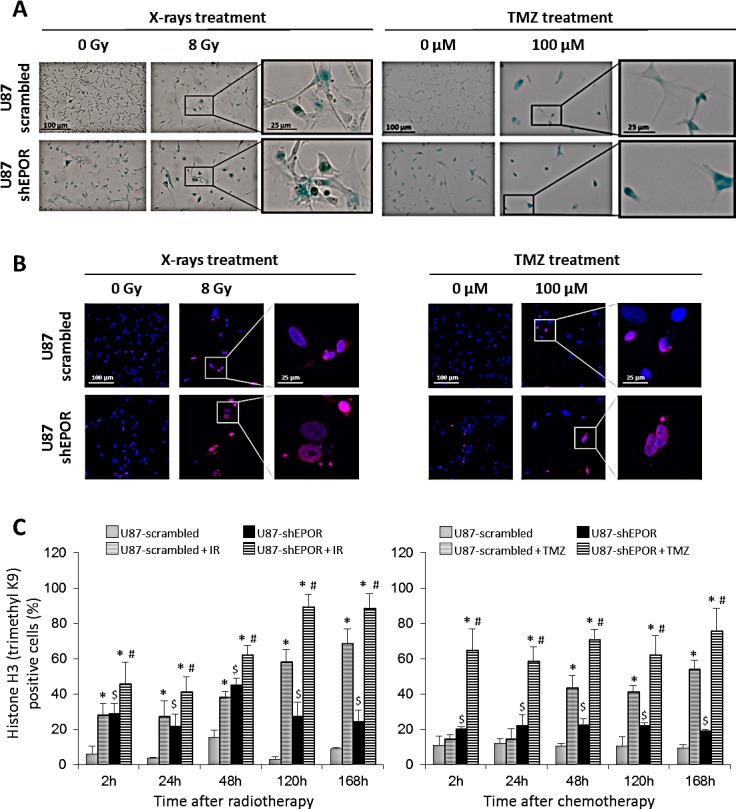
Figure 5. Senescence induced by X-rays treatment or temozolomide exposure is potentiated by EPOR inhibition on glioma cells.

(A) Representative photographs of senescence detected by β-galactosidase staining performed 5 days following a single dose of treatment (X-rays = 8 Gy or TMZ = 100 μM) on U87-scrambled and U87-shEPOR cells. The positive cells for senescence assay showed a blue coloration. Scale bar=100 μm for low magnification and scale bar=25 μm for high magnification. (B) Representative photographs of senescence detected by histone H3 (triMethylK9) immunostaining (red) on U87-scrambled and U87-shEPOR cells 5 days after X-rays (8 Gy) or TMZ (100 μM) treatments. Cell nuclei were identified with Hoechst 33342 staining (blue). Scale bar=100 μm for low magnification and scale bar=25 μm for high magnification. (C) Quantification of senescence on U87-scrambled and U87-shEPOR cells at different times (2h, 24h, 48h, 120h and 168h) after X-rays (8 Gy) (left graph) or TMZ (100 μM) (right graph) treatments. The proportion of histone H3 (TriMethylK9) positive cells was expressed relative to total cell number counted by Hoechst 33342 staining. Mean ± SD, n=9 (3 different experiments, 1 coverslip for each experiment, 3 representative fields per coverslip); * p<0.05 vs U87-scrambled or U87-shEPOR untreated for each cell type; $ p<0.05 vs U87-scrambled untreated and # p<0.05 vs U87-scrambled treated (Fisher's PLSD post-hoc test after a significant ANOVA).
