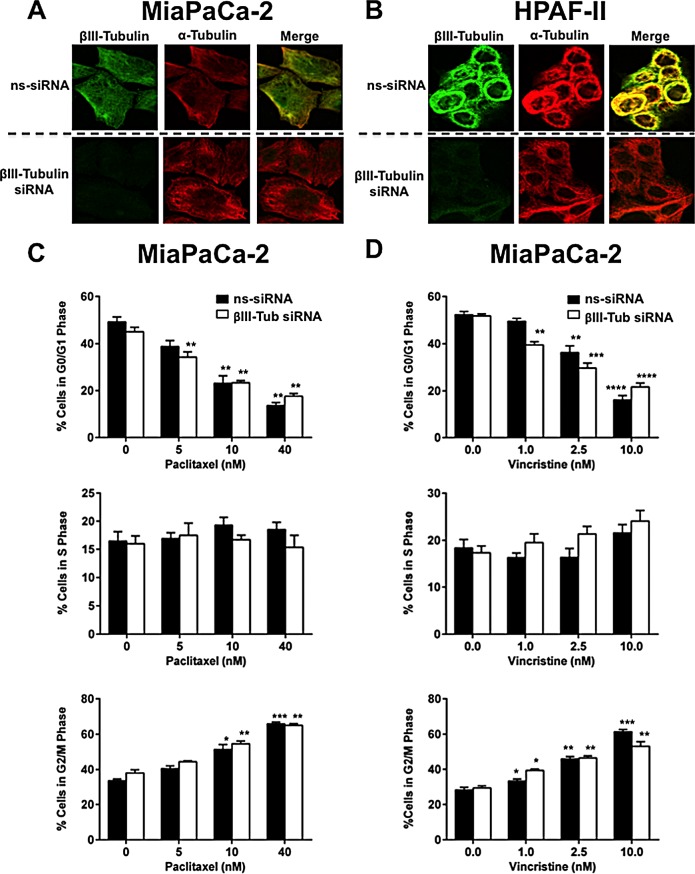
Figure 4. The effect of βIII-tubulin silencing on pancreatic cancer cell morphology and cell cycle.
A) Confocal microscopy for α-tubulin and βIII-tubulin in MiaPaCa-2 cells transfected with control siRNA (ns-siRNA) (top panels) or βIII-tubulin siRNA (βIII-Tub siRNA; bottom panels). Overlaid fluorescence images are shown in the far right panel of each row. B) as per A, except HPAF-II cells were used. C-D) Cell cycle distribution was analyzed by propidium iodide staining and flow cytometry. Bars represent % of MiaPaCa-2 cells in G0/G1-phase, S-phase, or G2/M-phase (mean±s.e.m.). 72h post-transfection with either ns-siRNA or βIII-Tub siRNA cells were incubated for eight hours with Paclitaxel (C) or Vincristine (D). Asterisks indicate significance relative to the no drug control of the same siRNA (* p≤0.05, *** p≤0.001, **** p≤0.0001; n=5).

