
Figure 3. Determination of cytotoxic CD3+ and CD8+ T lymphocytes.
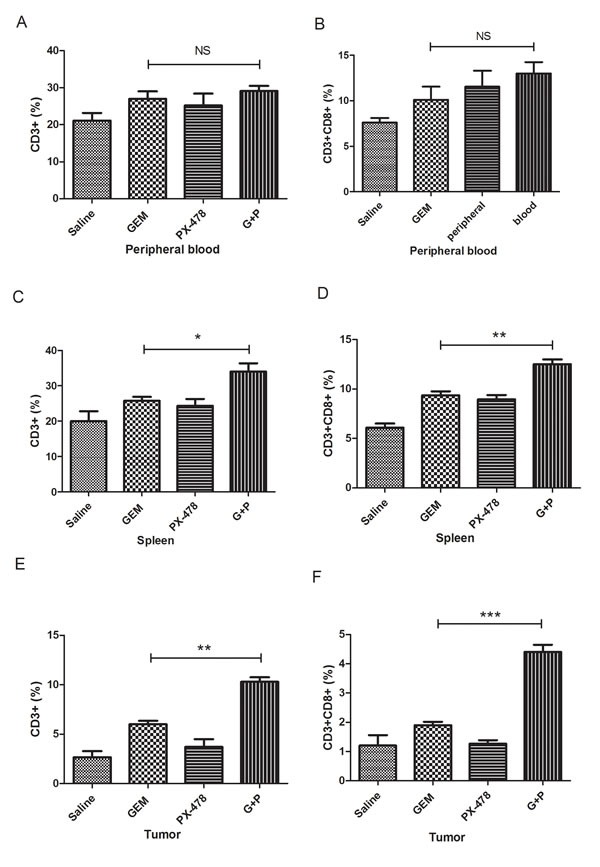
Panc02 cells were inoculated into the right flank of C57BL/6 mice (7 mice/group) and subsequently treated with Saline, Gem (i.p at 15 mg/kg on days 1, 3, 5 every week), PX-478 (p.o. gavage at 30 mg/kg ×2 consecutive days), or Gem/PX-478. The proportion of CD3+ and CD8+ T cells isolated from peripheral blood (A), spleen (B), or tumor (C) were analysed by flow cytometry. Statistical significance was analysed by two-tailed Student's t-test. Significantly increased T cells in Gem/PX-478 treated group were compared with treated with Gem or PX-478 alone (n=7). * indicates P<0.05, ** indicates P<0.01 and ‘NS’ means no significance.