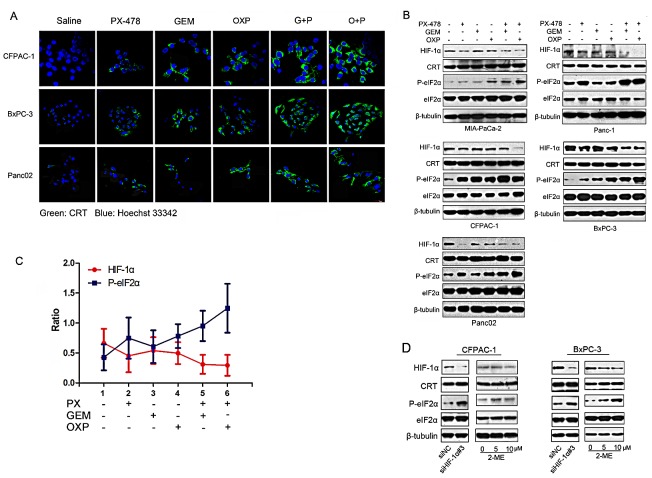
Figure 4. Negative correlation between HIF-1α expression and eIF2α phosphorylation.
PDAC cell lines were incubated with saline, Gem (1.0 μM), PX-478 (25 μM), Gem/PX-478, OXP (oxaliplatin) (300μM) or OXP/PX-478 for 24 hours. (A) CRT surface exposure on CFPAC-1, BxPC-3 and Panc02 cell lines. Non-permeabilized cells were co-stained with anti-CRT antibody and Hoechst 33342 and determined by confocal microscopy (magnification, 600×). Green colour indicates ecto-CRT. (B) Five PDAC cell lines were treated with GEM, PX-478, OXP (300μM), Gem/PX-478, or Gem/OXP for 24 hours. Expression of HIF-1α, CRT, P-eIF2α, and eIF2α was determined by Western blotting. β-tubulin was used as a loading control and OXP was served as a positive control. (C) Negative correlation between levels of HIF-1α and P-eIF2α. Expression levels of both HIF-1α and P-eIF2α were analysed by densitometry and represented as ratios of HIF-1α/β-tubulin and P-eIF2α/β-tubulin. Data were collected from 5 cell lines and expressed as mean ± SD. Correlation between HIF-1α and P-eIF2α was analysed by Pearson's correlation method. **P<0.01, γ=-0.943. (D) Pancreatic cancer cell lines (CFPAC-1 and BxPC-3) were treated with siHIF-1 and 2-ME and then evaluate the expression HIF-1α, CRT and P-eIF2α by Western blotting experiment.

