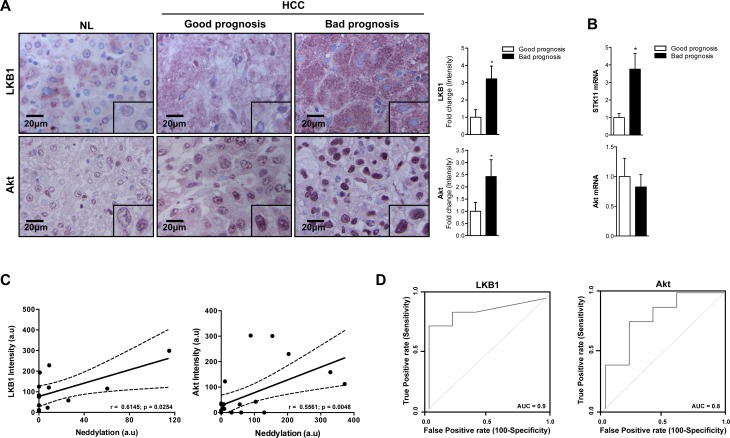
Figure 4. Association between LKB1, Akt and neddylation in human HCC.
(A) LKB1 and Akt IHC analysis in human samples from normal liver (NL) and HCC human samples from patients with good and bad prognosis. Graphical representations are shown on the right of each panel. (B) LKB1 and Akt mRNA expression in human samples from patients with HCC with good or bad prognosis. (C) Pearson's correlation between neddylation and LKB1 or Akt levels respectively. (D) ROC curves of LKB1 and Akt in good and bad prognosis of human HCC samples. The area under the ROC curve (AUC) measures the statistical potential of Akt and LKB1 to differentiate the two prognosis groups. Values are represented as mean ± SEM. *p<0.05 (Bad vs good prognosis).

