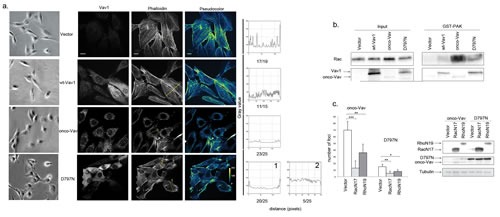
Figure 3. Rac1 and RhoA GTPases are effectors for D797N Vav1 mutant-induced transformation.

a. Cytoskeleton analysis. The indicated stable NIH3T3 cells lines were observed using light microscopy (Leica DMI6000, Camera MicroMAX 1300Y/HS, magnification 20x, first left panel) or were immunostained with Alexa 647-conjugated-phalloidin (right and middle panels) and anti-Myc Tag Ab followed by Alexa 488-conjugated anti-mouse Ig Ab (Vav1, second left panel). Pseudocolor images indicate the intensity gradients of cytoskeleton labelling (right panel). Bar = 12μm. Confocal images were acquired with a BD Pathway 855 Bioimaging System with a 40x magnification and analyzed by ImageJ software. A line was drawn across at least 15 cells from each different clone and linescan profiles of fluorescence intensity were obtained using the Analyze-Plot profile function. The numbers of cells presenting the indicated profiles are indicated for each cell line under the plot. b Rac1 activation. Rac1 activity was assessed in stable NIH3T3 cell lines using GST-Pak1 pull-down experiments (n=3). A representative experiment is shown (right panel). Cellular extracts were also analysed by immunoblottting for Rac1 and Vav1 expression (left panel) c. Rac1/RhoA are required for foci formation. NIH3T3 cells were transfected with Vav1 constructs altogether with empty, RacN17 or RhoN19 pRK5-myc based vectors as indicated. The number of foci was scored for each transfection. Columns represent the mean ± SD of 3 independent experiments performed in duplicate (left panel). Expression of Vav1, RacN17 and RhoN19 proteins was monitored by immunoblotting (right panel).
