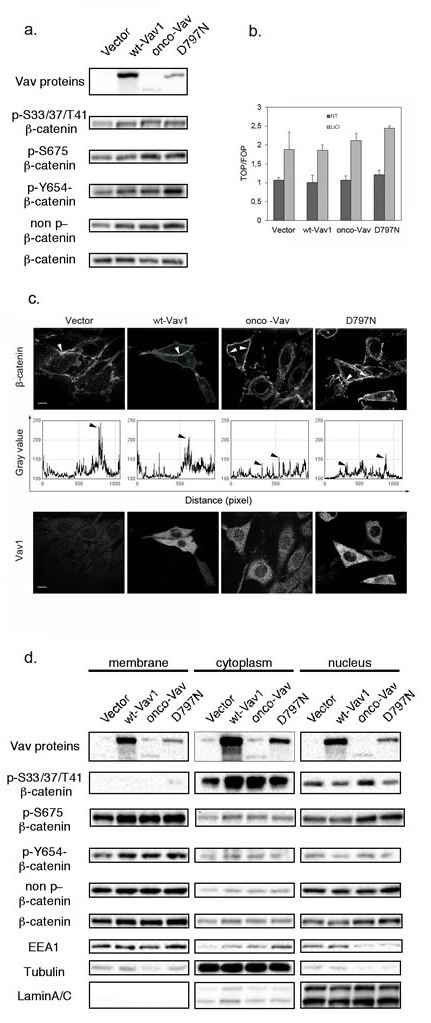
Figure 6. Vav1 influences β-catenin phosphorylation and subcellular localization.

The indicated cell lines were analyzed using: a and d. Sequential western blotting with the indicated Abs for total cell extracts (a) or after subcellular fractionation between membrane, cytoplasmic and nuclear fractions (d). b. TCF/Lef-luciferase reporter activation was evaluated in 293T cells 48h after transfection with the indicated constructs and incubation (LiCl, grey bars) or not (NT, black bars) with 30 mM LiCl. Expression was calculated relative to levels detected in control cells. Results are means ±SD of three independent experiments performed in triplicates. c. Immunofluorescence microscopy after immunostaining with Alexa 647-conjugated anti-β-catenin (upper panel) and anti-Myc tag Ab followed by Alexa 488-conjugated secondary Ab (Vav, lower panel). Fluorescence intensity of β-catenin labelling was analysed all along the membrane using the Analyze-Plot profile function (graphs in middle panel). Arrows indicate the peaks of intensity observed in the upper panel.
