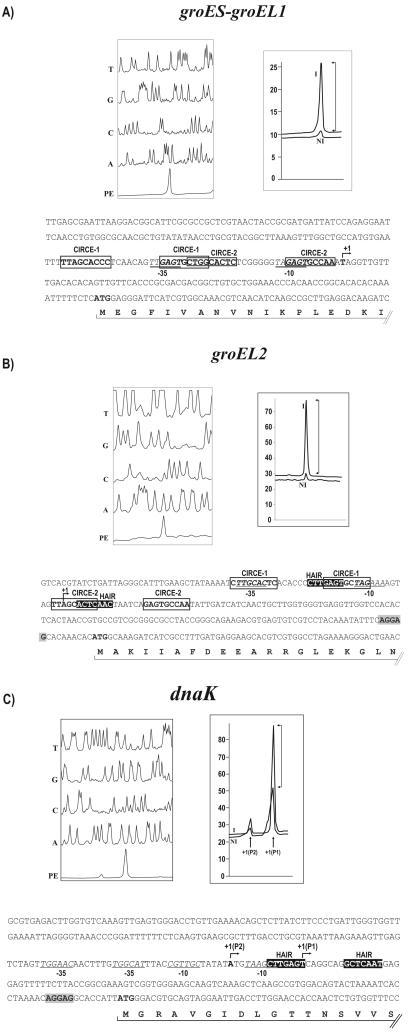
FIG. 3.
Primer extension analysis. The reaction sequences of the promoter region, T, G, C, and A, were compared with that of the primer extension (PE) reaction product. The peak area (right) is shown for the induced (I) and noninduced (NI) conditions. The transcription start point is indicated by +1 in the nucleotide sequence. The CIRCE sequences are boxed, and the HAIR sequences are in reverse-type letters. Ribosome binding sites are shaded. The −10 and −35 sequences are underlined and in italic letters. (A) Analysis of promoter region of the groES-groEL1 operon. (B) Analysis of the groEL2 promoter region. (C) Analysis of the dnaK promoter. Two products of the primer extension +1(P1) and +1(P2) are indicated. The Fragment Manager Program (Pharmacia Biotech) was used to analyze the reactions.

