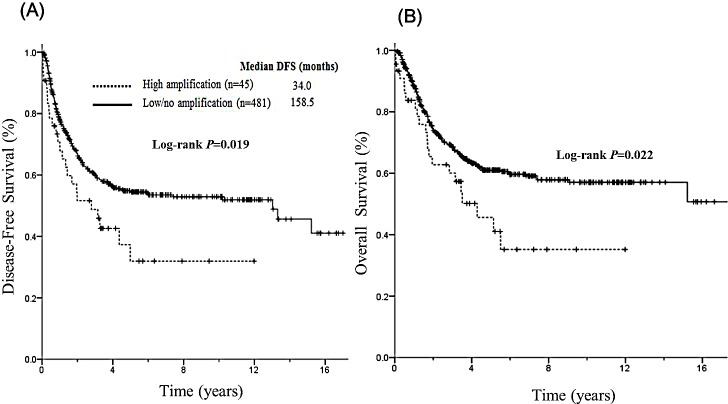
Figure 3. Prognostic impact of high FGFR1 amplification and low/no amplification on DFS and OS.
(A) The median DFS of the high FGFR1 amplification group was significantly shorter compared with low/no FGFR1 amplification group (P=0.019) (B) The median OS of high FGFR1 amplification group demonstrated significantly shorter than low/no FGFR1 amplification group (P=0.022).

