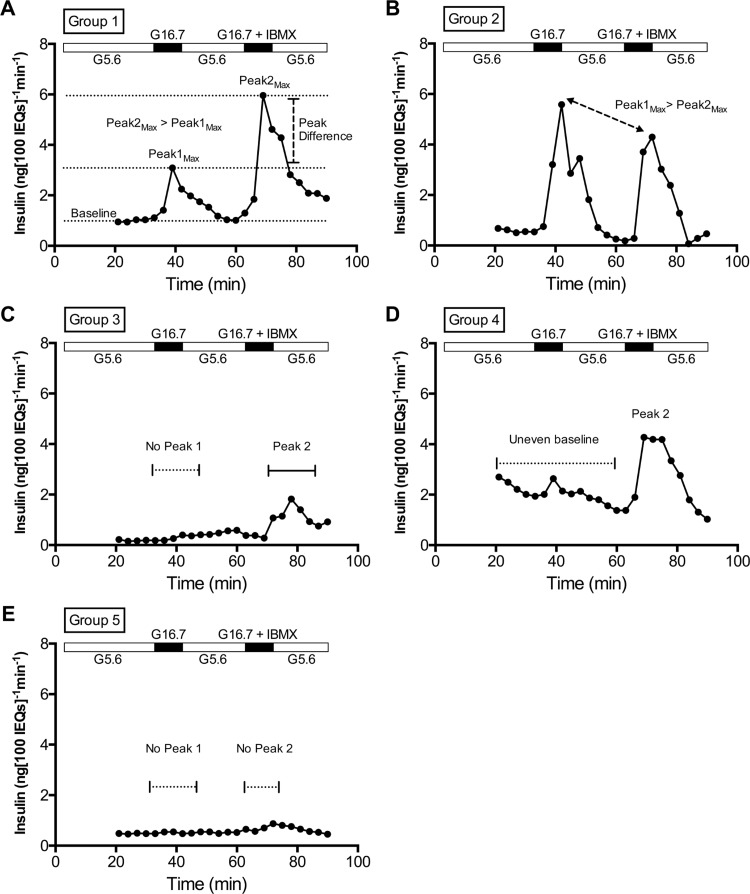
Fig. 2.
Definitions of in vitro response groups. Perifusion of human islets with the following order of stimuli in media: 5.6 to 16.7 mM glucose, back to 5.6 mM glucose, then to 16.7 mM glucose with IBMX. From the entire body of perifusion data, 5 general response groups emerged. A–E: real curves from representative preparations, illustrating characteristics of each Group. A: Group 1 had 2 stimulation peaks (16.7 mM glucose + IBMX induces a higher Peakmax than 16.7 mM glucose alone) and a stable Baseline. B: Group 2 differed from Group 1 by having a higher Peak1max (in response to 16.7 mM glucose) than Peak2max (in response to 16.7 mM glucose + IBMX). C: Group 3 had no Peak1 but did have a Peak2. D: Group 4 had an uneven Baseline but has one or both Peaks. E: Group 5 was considered nonresponsive, because it had neither Peak1 nor Peak2.

