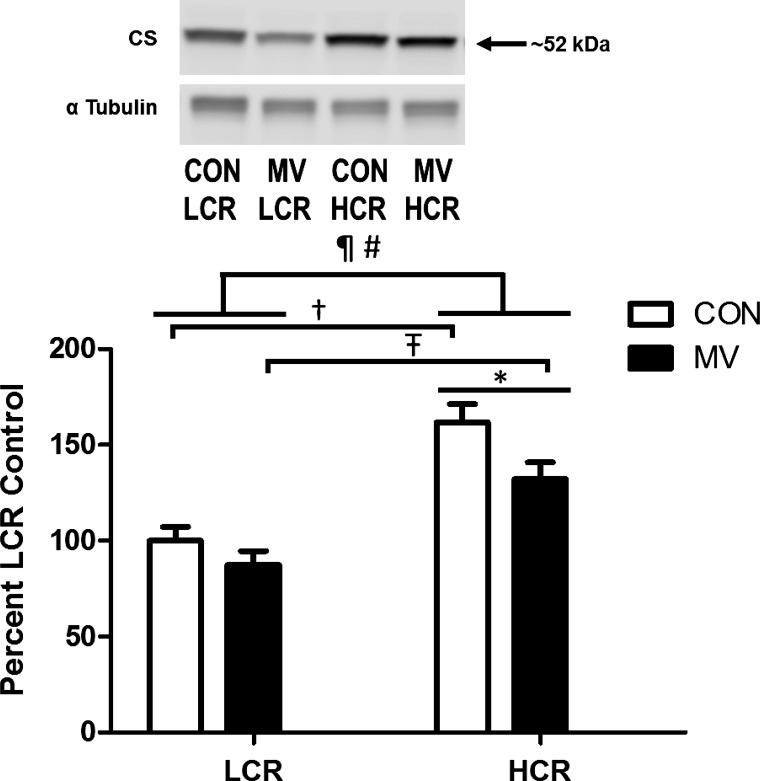
Fig. 5.
Assessment of citrate synthetase (CS) relative protein abundance in diaphragm muscle. Values are mean percent change compared with LCR control ± SE and normalized to α-tubulin. A representative Western blot is shown at top. ¶P < 0.05; main effect of strain (HCR vs. LCR). #P < 0.05; main effect of treatment (CON vs. MV). †P < 0.05; difference between strains within CON (HCR vs. LCR). ŦP < 0.05; difference between strains within MV (HCR vs. LCR). *P < 0.05; difference between treatment within HCR (CON vs. MV; n = 9–10).

