Fig. 4.
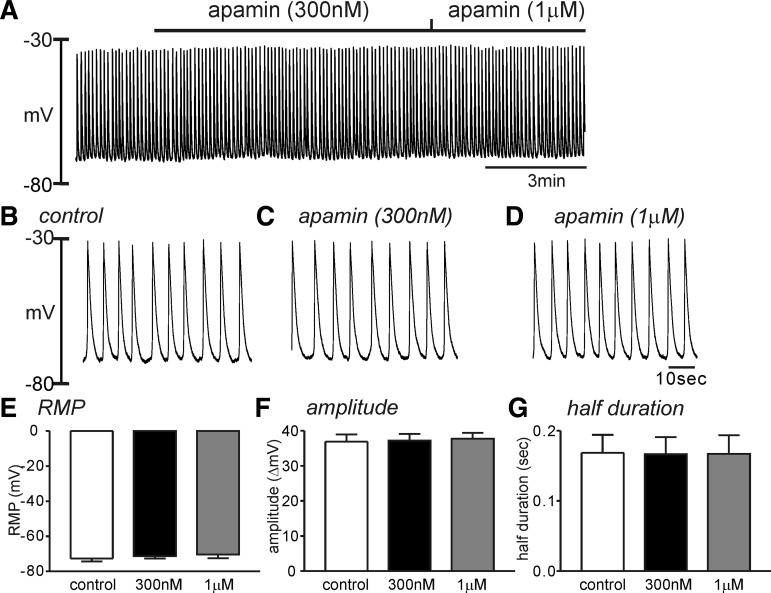
Effect of apamin on the slow wave potential in HGCS. A: a representative trace showed that apamin (300 nM and 1 μM) had no effect on the slow wave potentials in HGCS. B–D: expanded time scale from A in control (B), apamin (300 nM) presence (C), and apamin (1 μM) presence (D), respectively. E–G: summarized data showed no significant changes in the resting membrane potential (RMP, E) but no significance on the slow wave amplitude (F) and half-duration of slow wave potentials (G) from 5 samples in each concentration.

