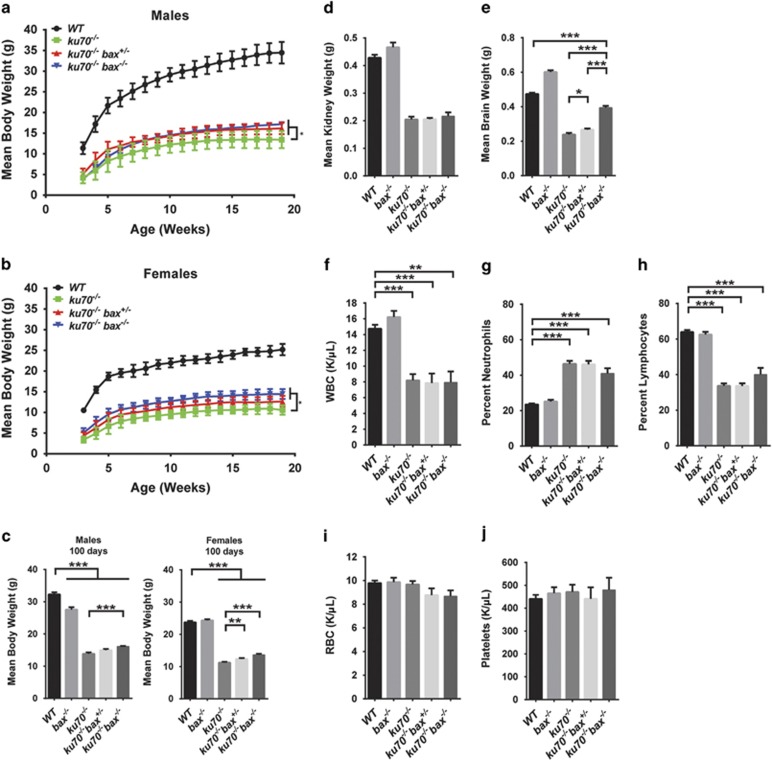
Figure 2.
Growth curves, organ weights, and hematocrit analyses. (a and b) The growth curves shown are based on the average body weights measured in (a) male WT (n=5), ku70−/− (n=9), ku70−/− bax+/− (n=8), and ku70−/− bax−/− (n=5) mice, and (b) female WT (n=6), ku70−/− (n=6), ku70−/− bax+/− (n=11), and ku70−/− bax−/− (n=6) mice. (c) The mean body weights are shown for 100 days of age for WT (males n=11; females n=10), bax−/− (males n=7; females n=3), ku70−/− (males n=17; females n=13), ku70−/− bax+/− (males n=7; females n=17), and ku70−/− bax−/− (males n=7; females n=9) mice. The average weights are shown for (d) kidney in WT (n=35), bax−/− (n=51), ku70−/− (n=9), ku70−/− bax+/− (n=9), and ku70−/− bax−/− (n=5) mice and (e) brain in WT (n=18), bax−/− (n=35), ku70−/− (n=9), ku70−/− bax+/− (n=12), and ku70−/− bax−/− (n=5) mice. (f–j) Hematocrit quantification of (f) WBCs and the percent composition of (g) neutrophils and (h) lymphocytes, (i) RBCs, and (j) platelets; WT (n=97), bax−/− (n=43), ku70−/− (n=20), ku70−/− bax+/− (n=15), and ku70−/− bax−/− (n=6). *P<0.05, **P<0.01, ***P<0.0001

