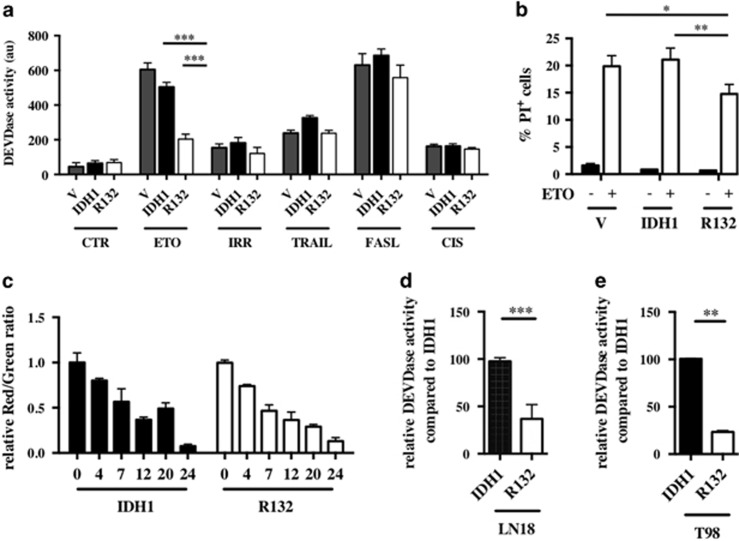
Figure 2.
(a) Caspase 3 activation was determined with DEVDase activity assay in stable transfected U251 cells expressing empty vector, wild-type and mutant IDH1 isoforms after induction of apoptosis. Cells were plated at 5 × 10⁵ cells and treated the next day with different inducers of cell apoptosis. Cellular extracts were prepared from untreated cells (CTR), 5 h after treatment with TRAIL (50 ng/ml), 24 h after ETO (50 μg/ml), FASL (60ng/ml) or cisplatin (CIS) (15 μg/ml) and 72 h after γ-irradiation (IRR; 5 Gy). (b) The number of dead cells 24 h after ETO (50 μg/ml) treatment was determined by FACS. Cells were incubated 5 min with propidium iodide (1 μg/ml) and analyzed by FACS. (c) The mitochondrial membrane potential was determined by FACS after ETO (50 μg/ml) treatment at different time points. Cells were incubated 15 min with JC-1 probe and analyzed by FACS. (d and e) Caspase 3 activation after 24 h ETO (50 μg/ml) exposure was determined with DEVDase activity assay, respectively, in wild-type and mutant IDH1-overexpressing LN18 and T98 cells. Results are expressed relative to wild-type IDH1-expressing cells. Results are expressed as the mean±S.E.M. of three experiments performed in triplicate. V, empty vector expressing cells; IDH1, wild-type IDH1-expressing cells; R132, IDH1R132-expressing cells transfected. *P<0.05, **P<0.01 and ***P<0.001

