Figure 4.
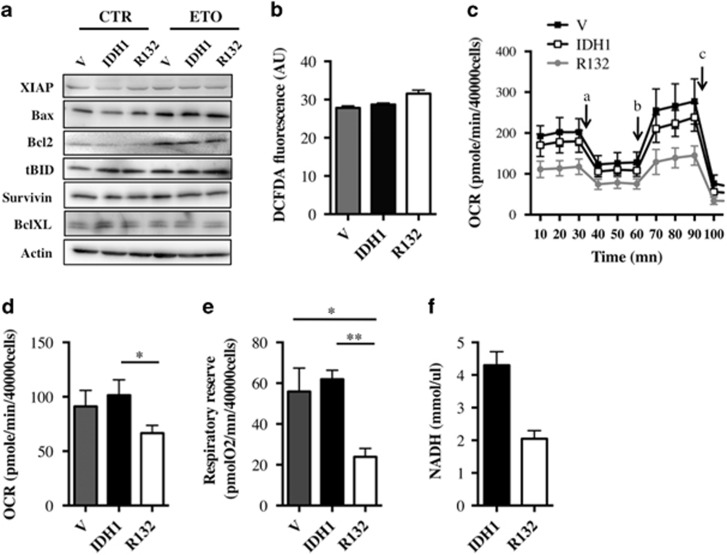
(a) Expression of proteins involved in apoptosis in U251 cells expressing empty vector, wild-type and mutant IDH1 isoforms. Whole lysates of cells were isolated 24 h after vehicule (V) or etoposide (ETO) treatment and analyzed (40 μg) by immunoblotting with the indicated antibodies (left panel). Actin was used as a loading control. (b) ROS production was measured using the DCFDA probe. U251 cells expressing empty vector, wild-type and mutant IDH1 isoforms were seeded at 2.5 × 10⁴ cells then incubated with the DCFDA probe. Fluorescence was measured at 538 nm every 3 min for 75 min and the slope corresponding to ROS production was calculated. (c) Oxygen consumption rate (OCR) of stable cells expressing empty vector, wild-type and mutant IDH1 isoforms was measured over time. Cells (4 × 10⁴) were plated and OCR was measured 24 h later by a XF24 Analyzer (Seahorse Bioscience). Mitochondrial inhibitors (oligomycin(a), CCCP(b), and rotenone and antimycin A(c)) were added as indicated with arrows. (d) Basal oxygen consumption was determined by measuring OCR as in c removing the non-mitochondrial oxygen consumption (OCR upon rotenone and antimycin A treatment). (e) The respiratory reserve of U251 cells expressing empty vector, wild-type and mutant IDH1 isoforms was measured by a XF24 Analyzer (Seahorse Bioscience). The respiratory reserve was determined as the difference between maximal OCR and basal OCR. (f) NADH production of cells expressing wild-type or mutant IDH1 isoforms. Cells (1 × 10⁶) were plated, lysed the next day and subsequently assayed for their ability to produce NADH. Results are expressed as the mean±S.E.M. of three experiments performed in triplicate

