Figure 6.
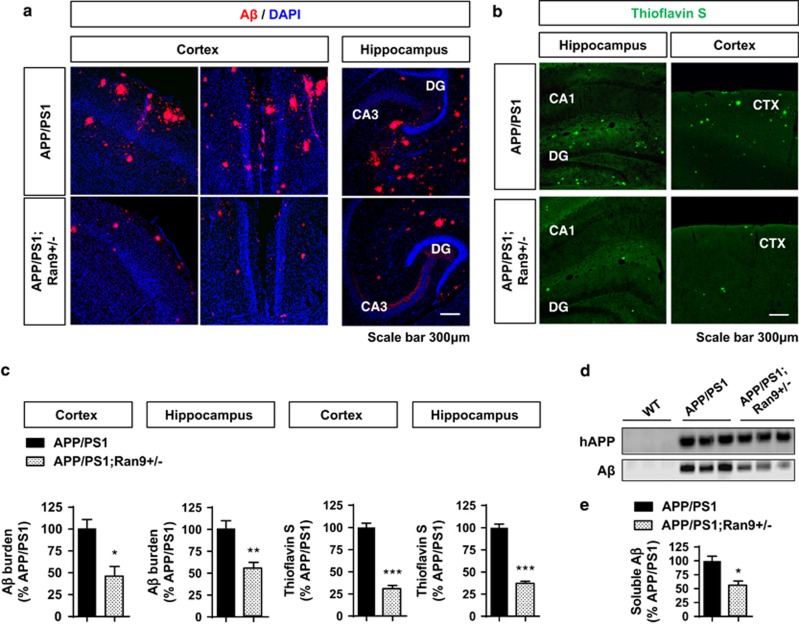
Mitigation of Aβ accumulation by RanBP9 reduction in APP/PS1 mice. (a) Representative immunohistochemical images showing reductions in Aβ deposits (red) in the anterior cortex and hippocampus of 8-month-old APP/PS1;RanBP9+/− mice compared with littermate APP/PS1 mice. (b) Representative images showing reductions in thioflavin S-positive fibrillar Aβ deposits in the anterior cortex and hippocampus of 8-month-old APP/PS1;RanBP9+/− mice compared with littermate APP/PS1 mice. (c) Quantitation of area covered by Aβ deposits normalized to APP/PS1 mice in the anterior cortex and hippocampus (Cortex: t-test,*P=0.0155, n=4 each; Hippocampus: t-test, **P=0.0067, n=4 mice per genotype, 2 F and 2 M). Quantitation of area covered by thioflavin S-positive fibrillary Ab deposits in the anterior cortex and hippocampus (t-test, ***P<0.0005, n=4 mice per genotype, 2 F and 2 M). Error bars represent S.E.M. in graphs. (d) Hippocampal extracts from 6-month-old WT, APP/PS1, and APP/PS1;RanBP9+/− mice immunoblotted for human APP (6E10—Triton-X100 extract) and Aβ (PBS extract). (e) Quantification of soluble Aβ levels (PBS extract) from 6-month-old APP/PS1 and APP/PS1;RanBP9+/− hippocampus (t-test, *P=0.0167, n=3 mice per genotype)

