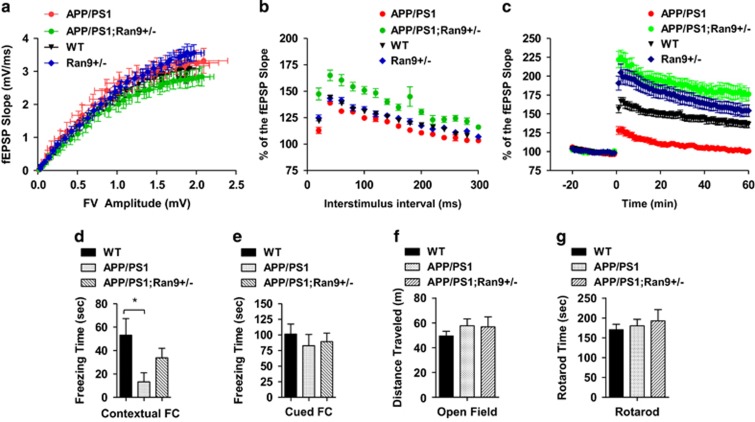
Figure 8.
Rescue of synaptic plasticity and contextual memory impairments in APP/PS1 mice by RanBP9 reduction. (a-c) Stimulating electrode placed in the Schaffer collaterals of the hippocampus and recording glass electrode positioned at the CA1 stratum radiatum below the pyramidal cell layer. (a) Input–output analysis performed by stepping up stimulation amplitude from 1–15mV in WT, APP/PS1, RanBP9+/−, and APP/PS1;RanBP9+/− acute slices. No significant differences observed. Slices from WT n=45, RanBP9+/− n=31, APP/PS1 n=19, APP/PS1;RanBP9+/− n=25; slices derived from four to six mice per genotype. (b) PPF showing significant differences among all interstimulus intervals (two-way ANOVA, genotype: P<0.0001; interstimulus interval: P<0.0001; interaction: P=0.0122). Post-hoc Tukey test shows significant increases in fEPSP slope in APP/PS1;RanBP9+/− slices compared with WT, RanBP9+/−, and APP/PS1 slices at nearly all interstimulus intervals (P<0.05 to P<0.0001). Slices from WT n=49, RanBP9+/− n=33. APP/PS1 n=31, APP/PS1;RanBP9+/− n=25; slices derived from four to six mice per genotype. (c) No significant changes between genotypes at baseline before LTP but LTP induced by theta burst stimulation showing significant differences in fEPSP slope among WT, APP/PS1, RanBP9+/−, and APP/PS1;RanBP9+/− slices (two-way ANOVA, genotype: P<0.0001; time: P<0.0001; interaction: P<0.0001). Post-hoc Tukey test shows significant differences between all genotypes at all time points after theta burst stimulation (P<0.0001) except between RanBP9+/− versus APP/PS1;RanBP9+/−. Slices from WT n=41, RanBP9+/− n=28, APP/PS1 n=33, APP/PS1;RanBP9+/− n=29; slices derived from four to six mice per genotype. (d) Quantitation of contextual fear conditioning (FC) freezing times (sec) after training session 24 h earlier across genotypes. Kruskal–Wallis ANOVA, post-hoc Dunn's, *P<0.05, WT n=12 (5 F and 7 M), APP/PS1 n=8 (4 F and 4 M), APP/PS1;RanBP9+/− n=6 (3 F and 3 M). (e) Quantitation of cued fear conditioning (FC) freezing times (sec) across genotypes (no significant differences by Kruskal–Wallis test or one-way ANOVA). Same number and gender as contextual FC. (f) Quantitation of open field activity test (total distance traveled over two- day training sessions) across genotypes (no significant differences by Kruskal–Wallis test or one-way ANOVA). Same numbers and gender as contextual FC. (g) Quantitation of rotarod test (time staying on rotarod) across genotypes (no significant differences by Kruskal–Wallis test or one-way ANOVA). Error bars represent S.E.M. in graphs. Same number and gender as contextual FC

