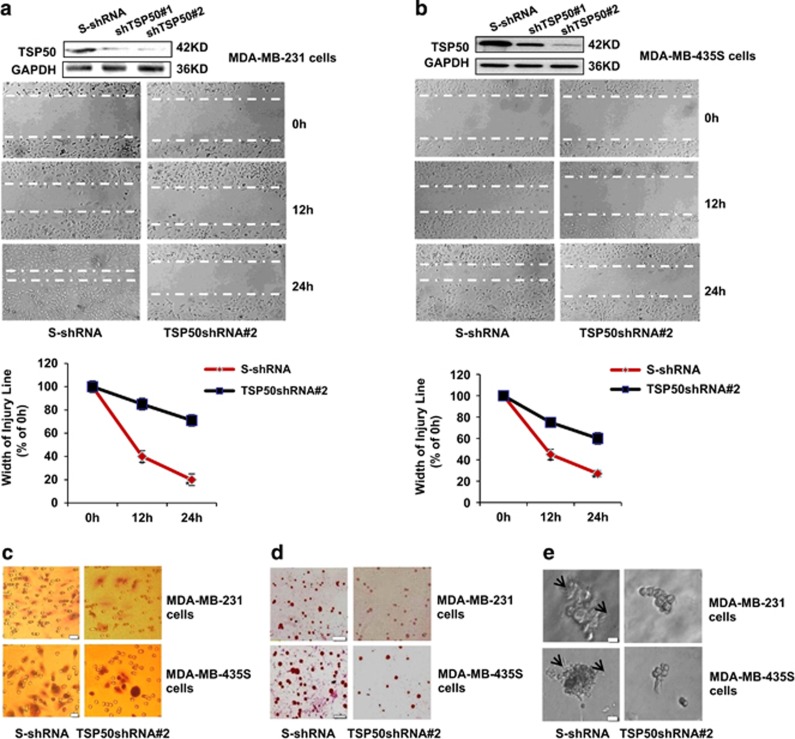
Figure 2.
Silencing of endogenous TSP50 inhibited cell migration and invasion. (a) Top panel: western blotting assay of TSP50 expression in MDA-MB-231 cells transfected with scrambled shRNA and TSP50 shRNA vectors. Middle panel: knockdown of endogenous TSP50 inhibited migration of MDA-MB-231 cells. Bottom panel: curve of different time intervals showing wound closure. (b) Top panel: western blotting assay of TSP50 expression in MDA-MB-435S cells transfected with scrambled shRNA and TSP50 shRNA vectors. Middle panel: knockdown of endogenous TSP50 inhibited migration of MDA-MB-435S cells. Bottom panel: curve of different time intervals showing wound closure. (c) Knockdown of endogenous TSP50 inhibited invasion of MDA-MB-231 and MDA-MB-435S cells. Scale bar, 50 μm. (d) Knockdown of endogenous TSP50 inhibited adhesion of MDA-MB-231 and MDA-MB-435S cells. Scale bar, 150 μm. (e) Knockdown of endogenous TSP50 changed the morphology of MDA-MB-231 and MDA-MB-435S cells in three-dimensional (3D) cultures system. The arrow points out the filopodium. Scale bar, 50 μm

